BeamNG Lap Analysis Using Telemetry Data
Overview
Last year I used a Python script to pull live data from BeamNG and plot it. As described here, BeamNG can use the OutGauge protocol to send out UDP packets that can be received by something and unpacked. At the time, I thought BeamNG could only send a limited amount of data - anything relating to specific details of the car (brake temperatures, downforce, engine damage, etc.), I thought, wasn’t possible.
It turns out that BeamNG is able to send out whatever data it holds about a particular vehicle (the list is very, very long). By editing the OutGauge.lua file found in the BeamNG game files, it’s possible to send data that I thought was impossible to send. This discovery therefore opened up endless possibilities of what could be sent to my Python program.
The original program plotted throttle, brake and clutch input (one graph), speed, RPM and fuel load. The update to this project aimed to build a program that could be used to analyse driving and see what changes to the tuning could be made to help improve lap times.
The contents of this section are as follows:
- Description of the car to be tuned and how it handles generally
- Explanation of the Python Program
- Analysis of best laps
Before delving into the contents of this section, I can’t claim to be extremely knowledgeable regarding race car dynamics. However, I hope that this section will be an enjoyable read, even if some parts might not be entirely accurate.
The Car In Question
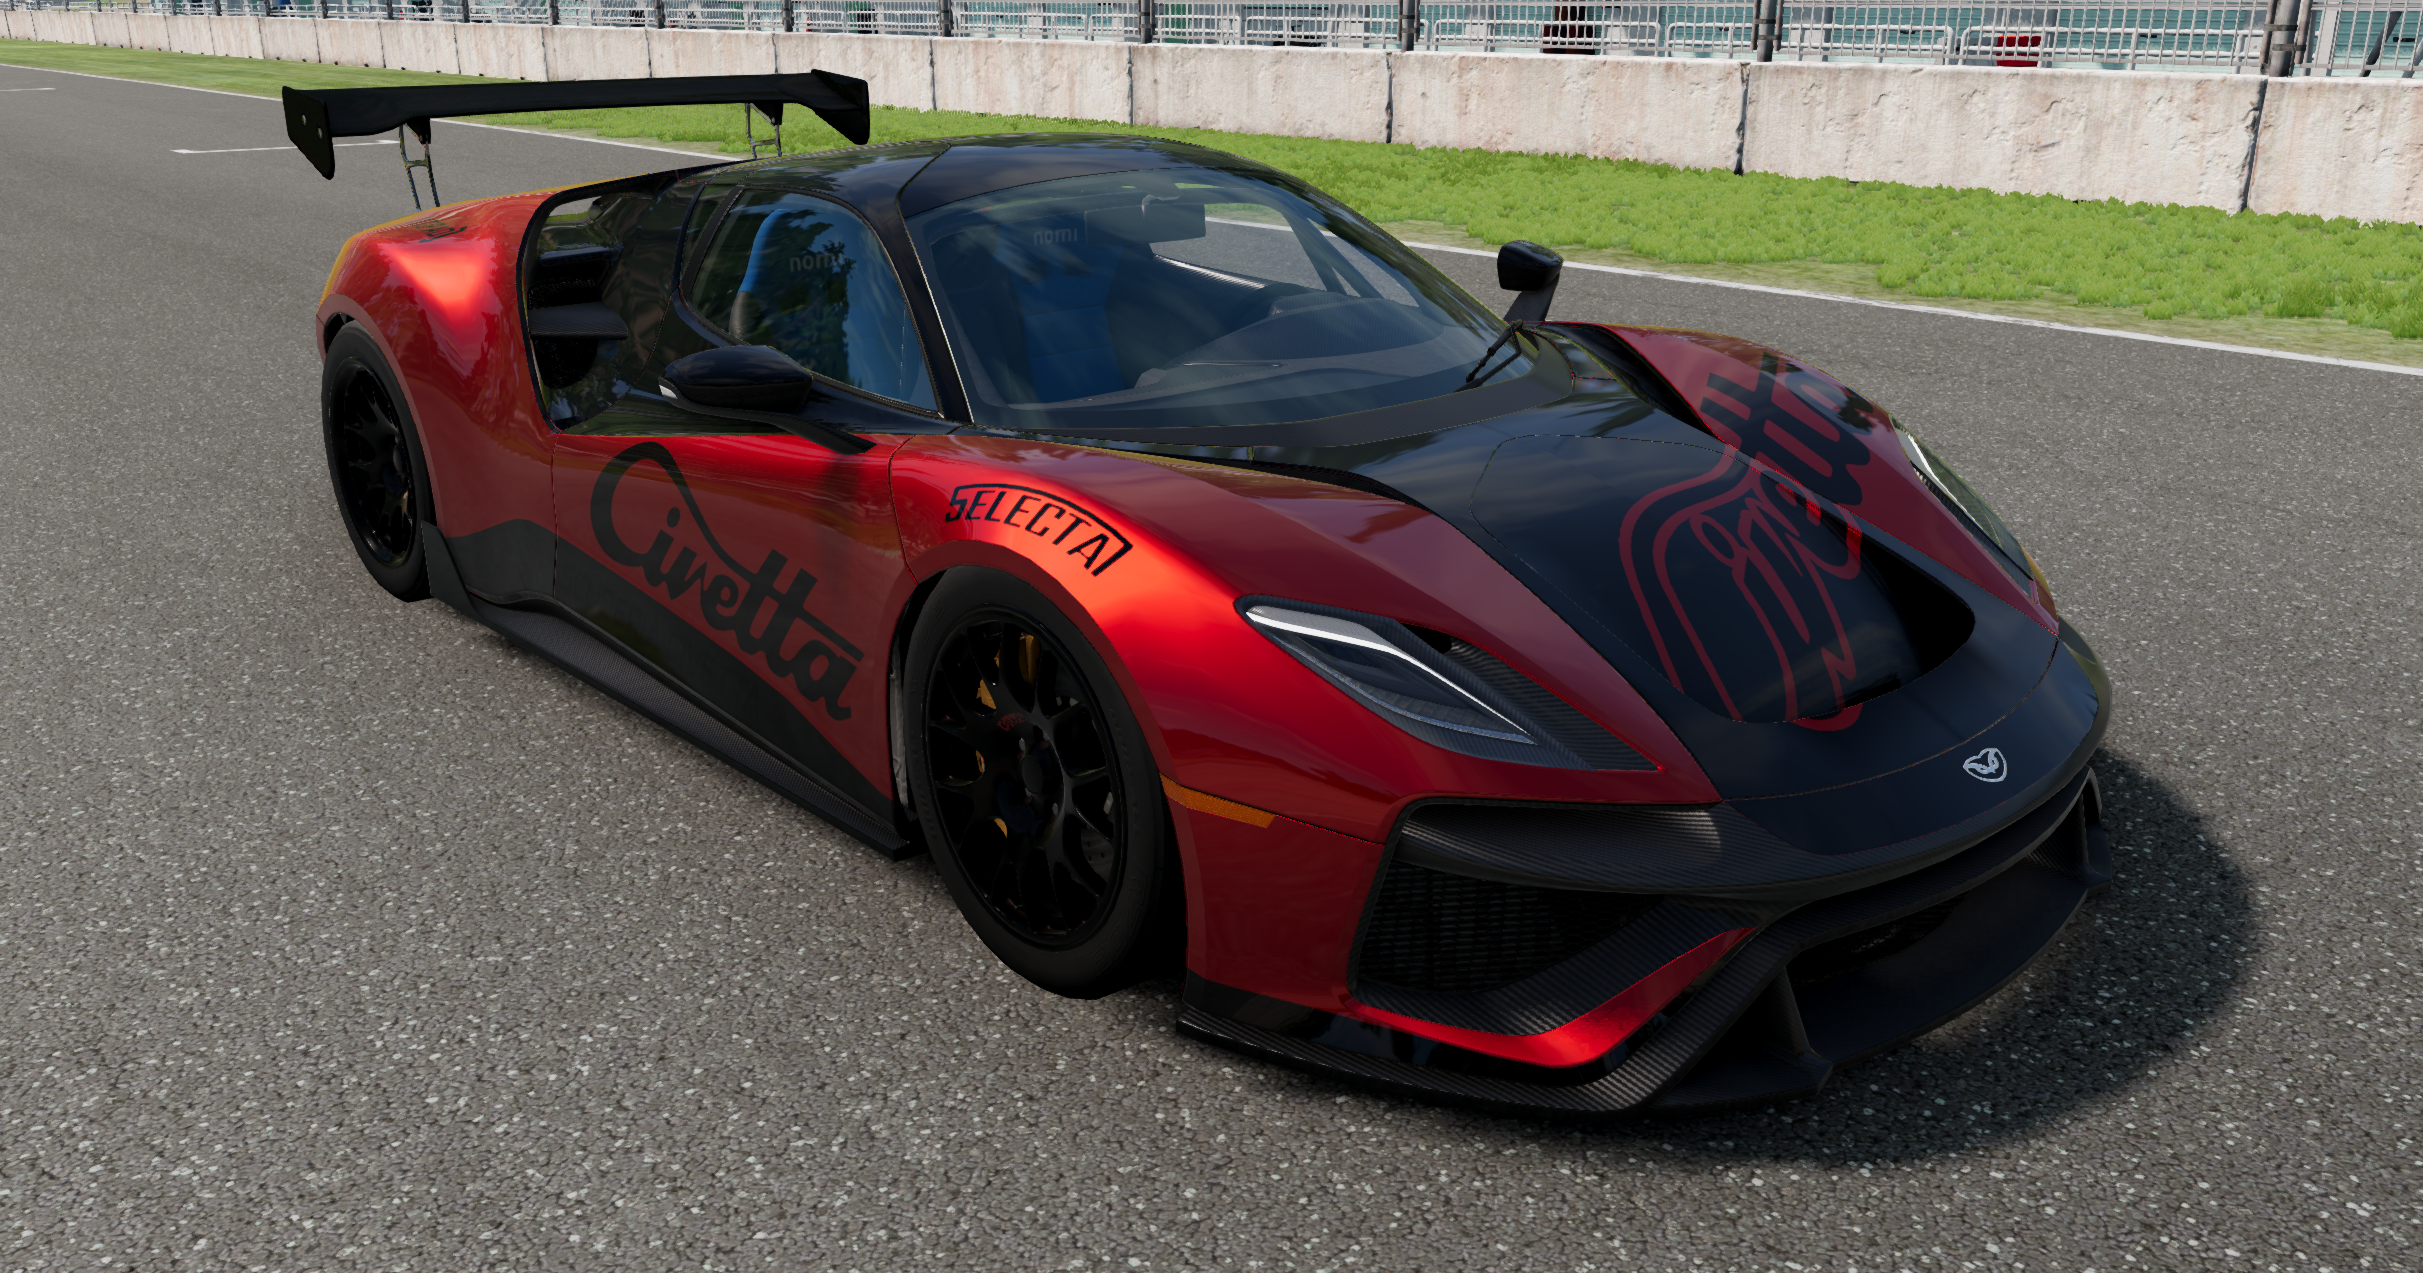
The car used in this project was the Civetta Scintilla Race and appears to be somewhat based on GT3 specifications (but would not fit in the GT3 class). It features a 5.0L V10 engine, which can produce up to 738BHP at 8850rpm. Full tuning details (before and after) are shown in the appendix.
Before performing an analysed pre-tune lap, I spent some time driving around the Hirochi Raceway circuit map to get a feel for the circuit and how the untuned car handles.
The best phrase I can use to best describe how the untuned car felt to drive: ‘unplanted’. It often felt quite ‘floaty’ when encountering successive steering changes (going through a chicane, for example). Furthermore, it was incredibly easy to use too much power when exiting a corner and lose control. I found myself either reducing throttle input or going to a higher gear when exiting most corners, from fear of losing control. It felt as though I had to wait for the car to be fully straight before committing to full throttle.
Python Program
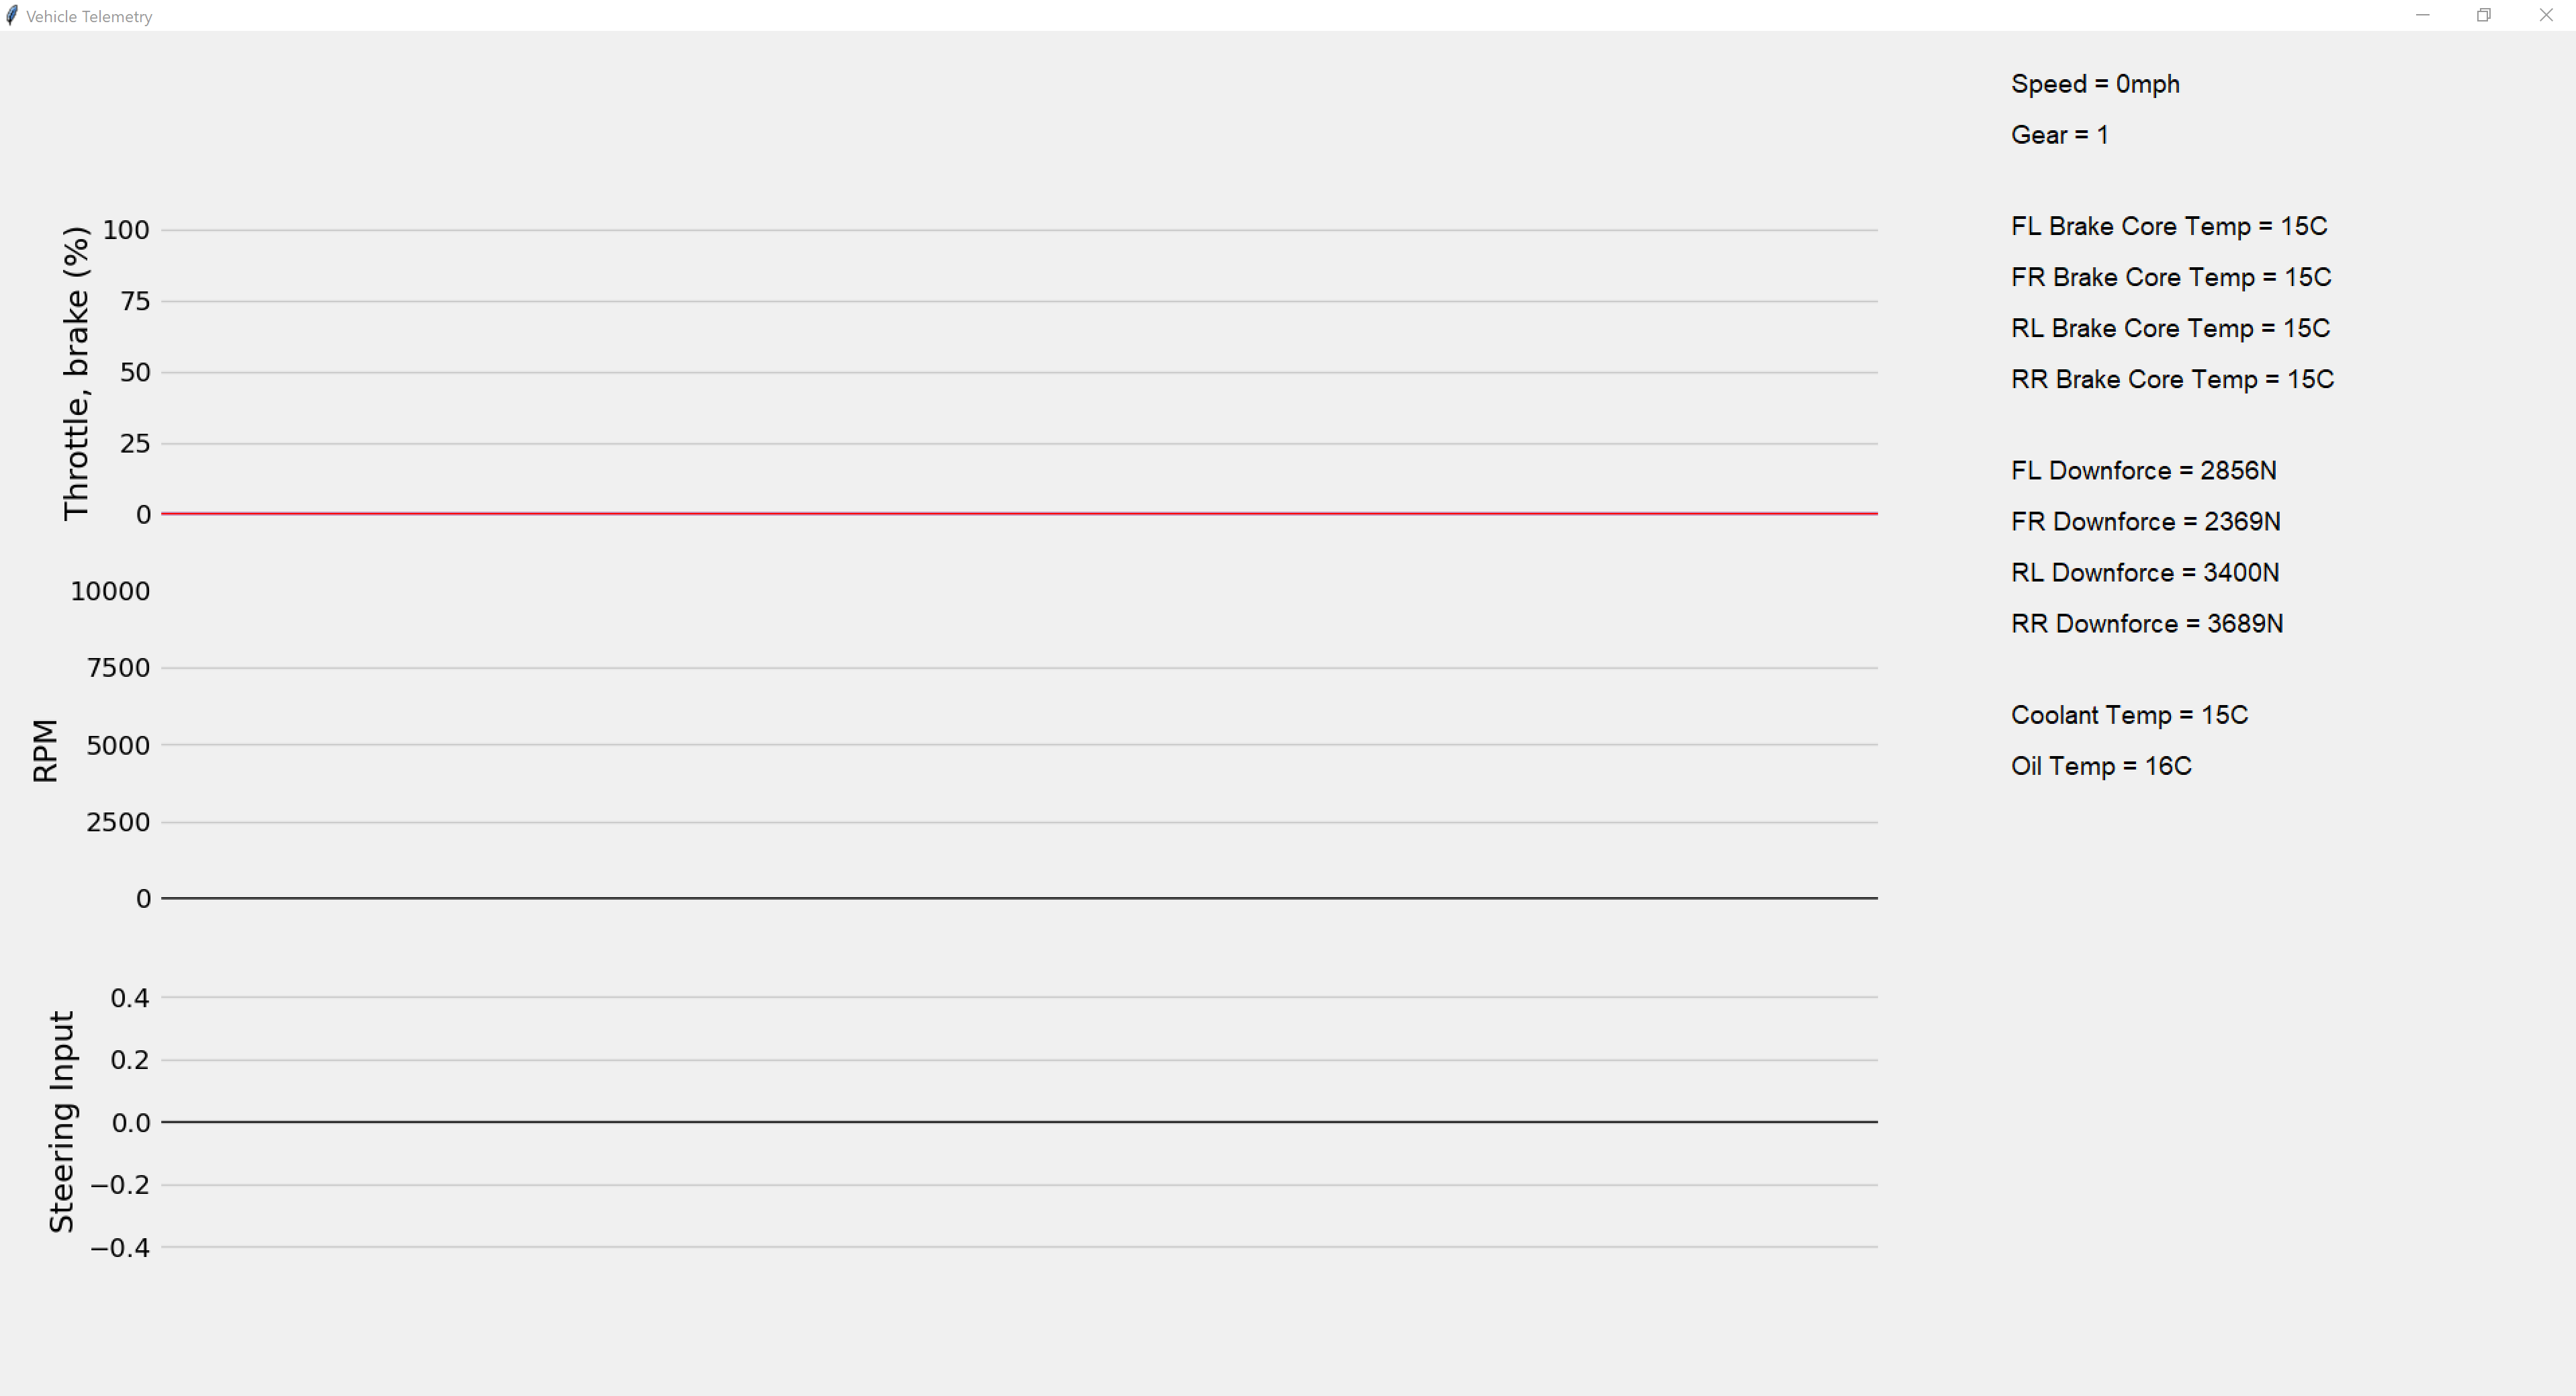
The program builds upon the previous by adding more graphs and data. New features include: a steering input graph, changing the speed graph to display an integer value, current gear, brake temperatures, downforce over each wheel and oil/coolant temperatures.
Despite not being a fully fledged program (compared to professional racing teams), the aim is to provide enough data to see where improvements can be made throughout a lap.
The program works by: opening a UDP socket to receive the incoming data from BeamNG, receiving the data, unpacking it into a suitable format, passing unpacked data to another function which handles the graph plotting and live integer updates and finally the GUI package Tkinter is used to provide the GUI.
The graphs themselves were plotted using matplotlib and were, essentially, embedded into the Tkinter GUI. The text on the right was created using Tkinter labels. Initially, the labels are blank but the aforementioned function configures the labels with text and constantly updates them with the correct values.
As discussed in the previous post, plotting four simultaneous graphs caused the graphs to plot slower than what I liked. An improvement to this program uses the Python Multiprocessing package. Before implementing this, a single processor thread was responsible for the entire program. Now, the data receiving and data plotting are assigned to different threads, allowing for extra performance. The x-axis labels were also removed, which improved graph plotting speed.
Lap Comparisons
In this section, setup 1 refers to the car before tuning and setup 2 refers to the car after tuning.
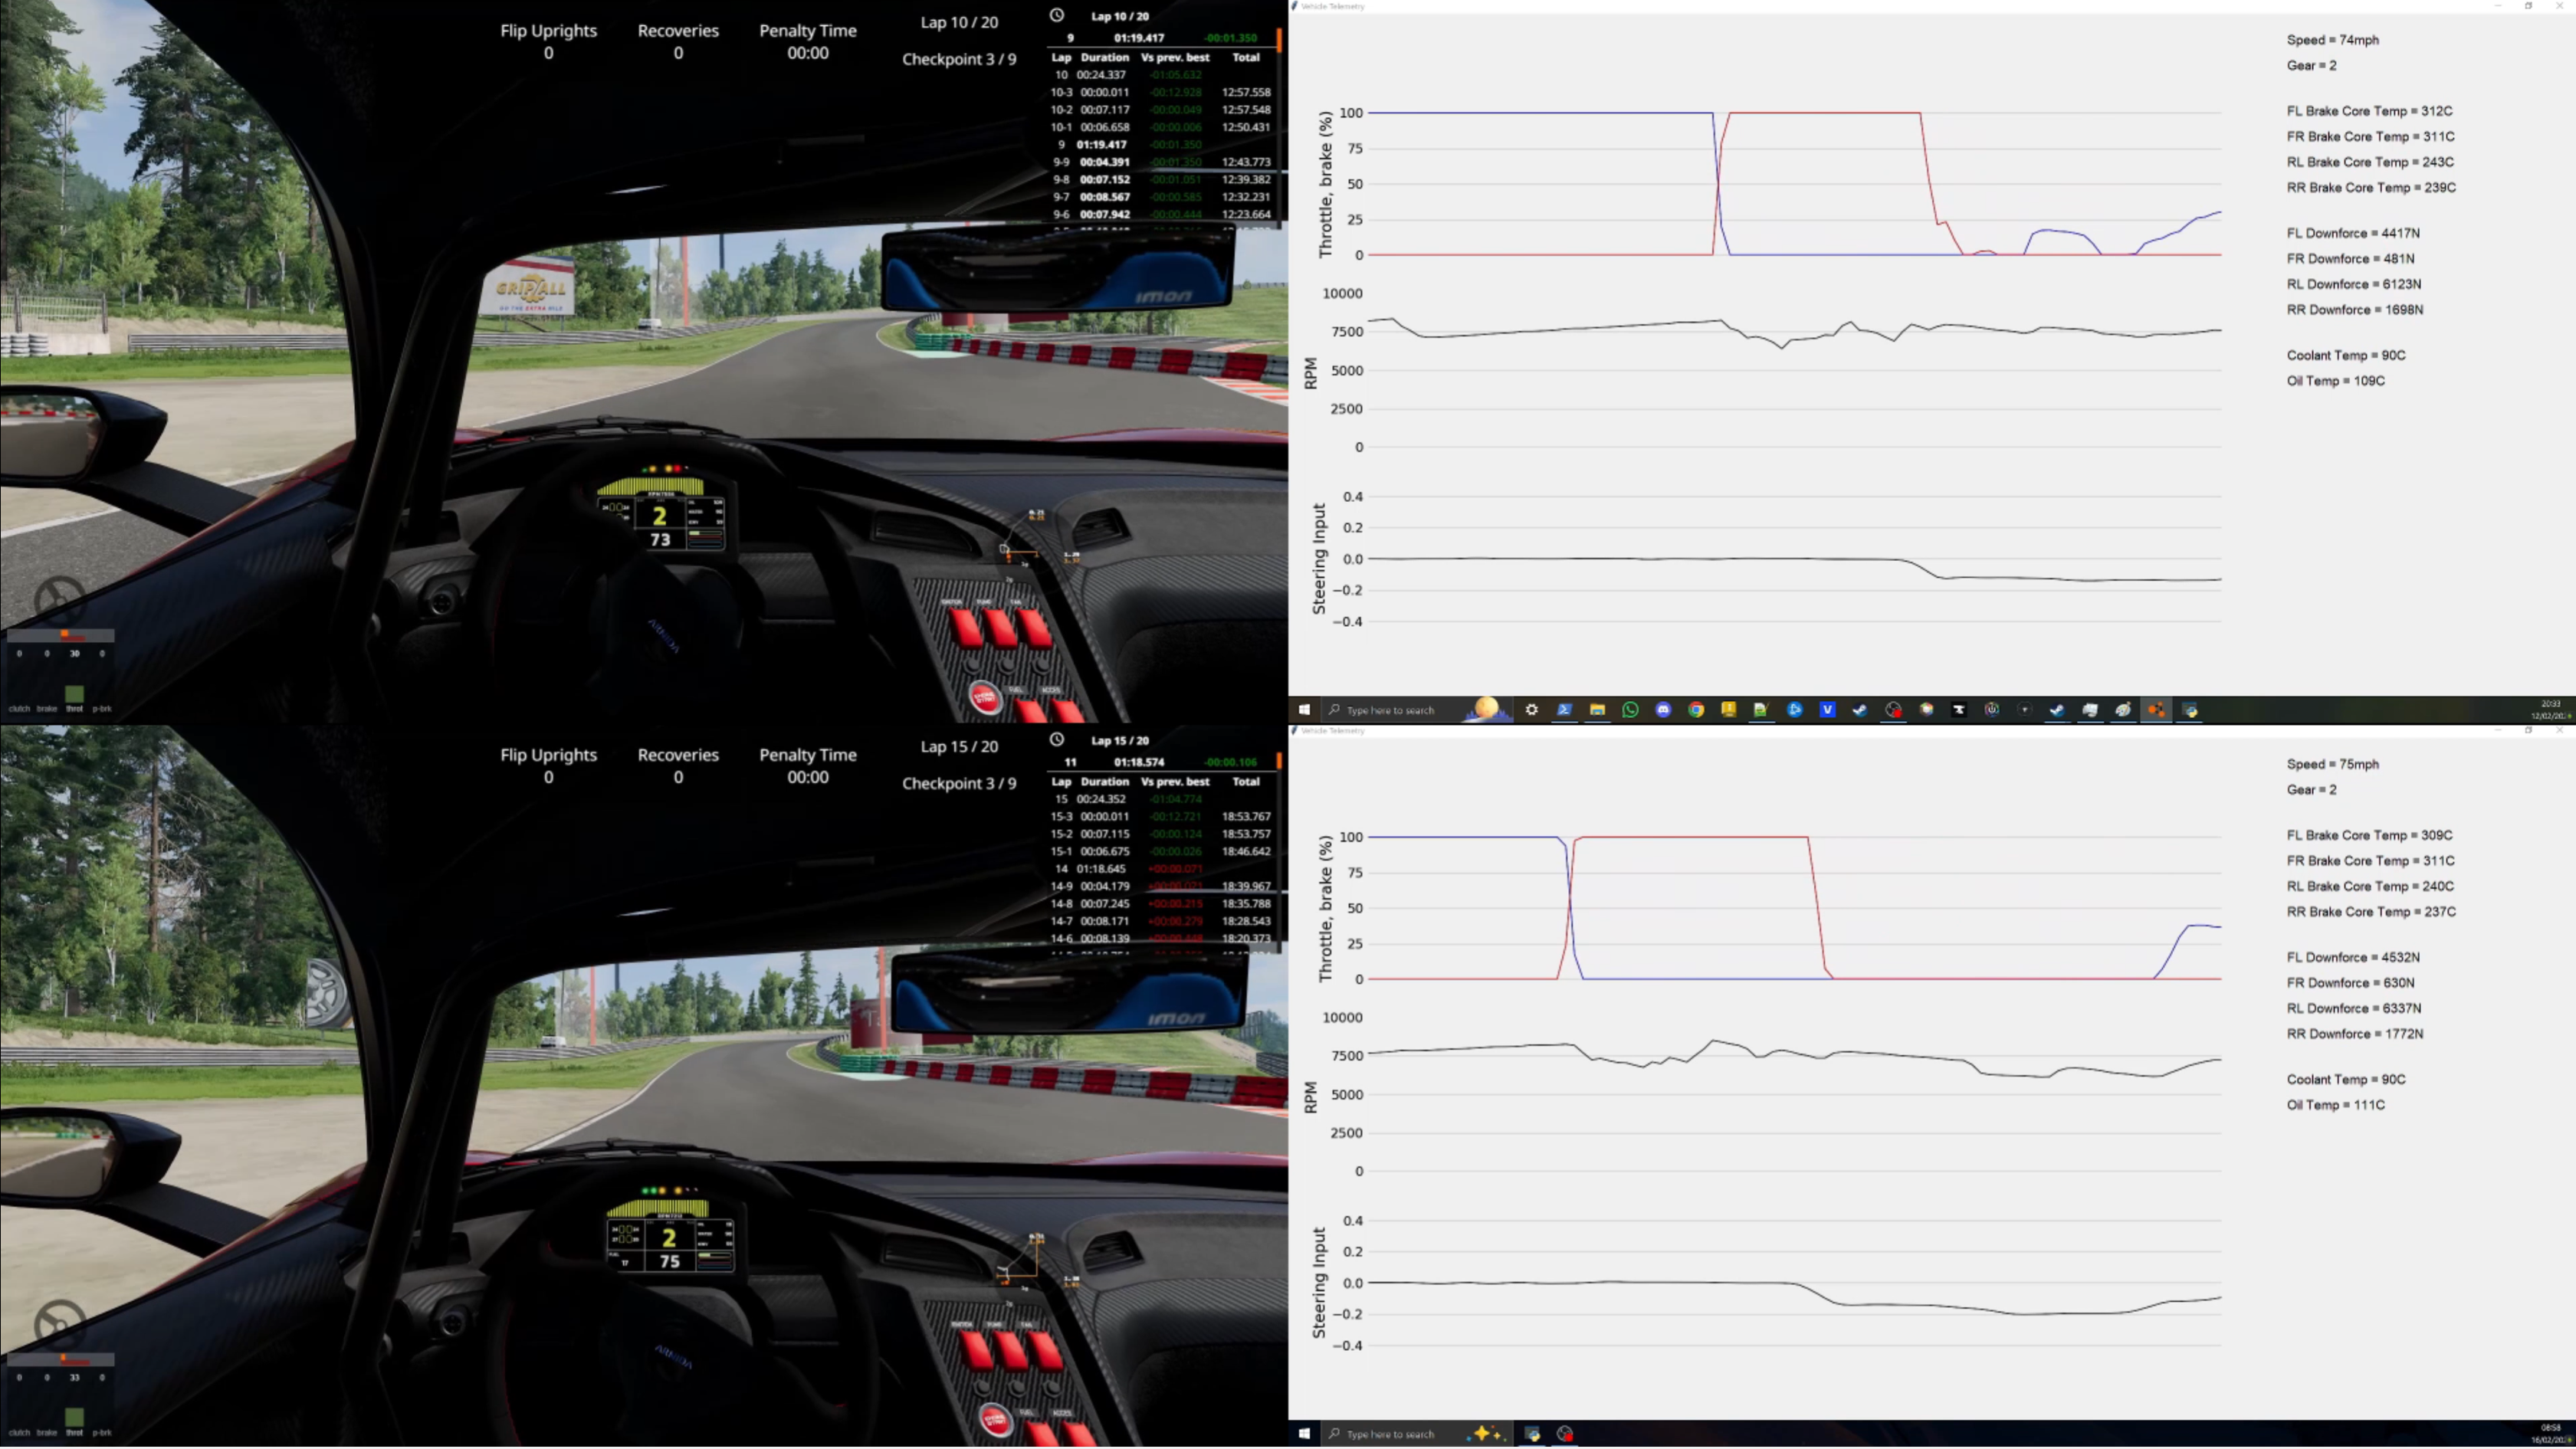
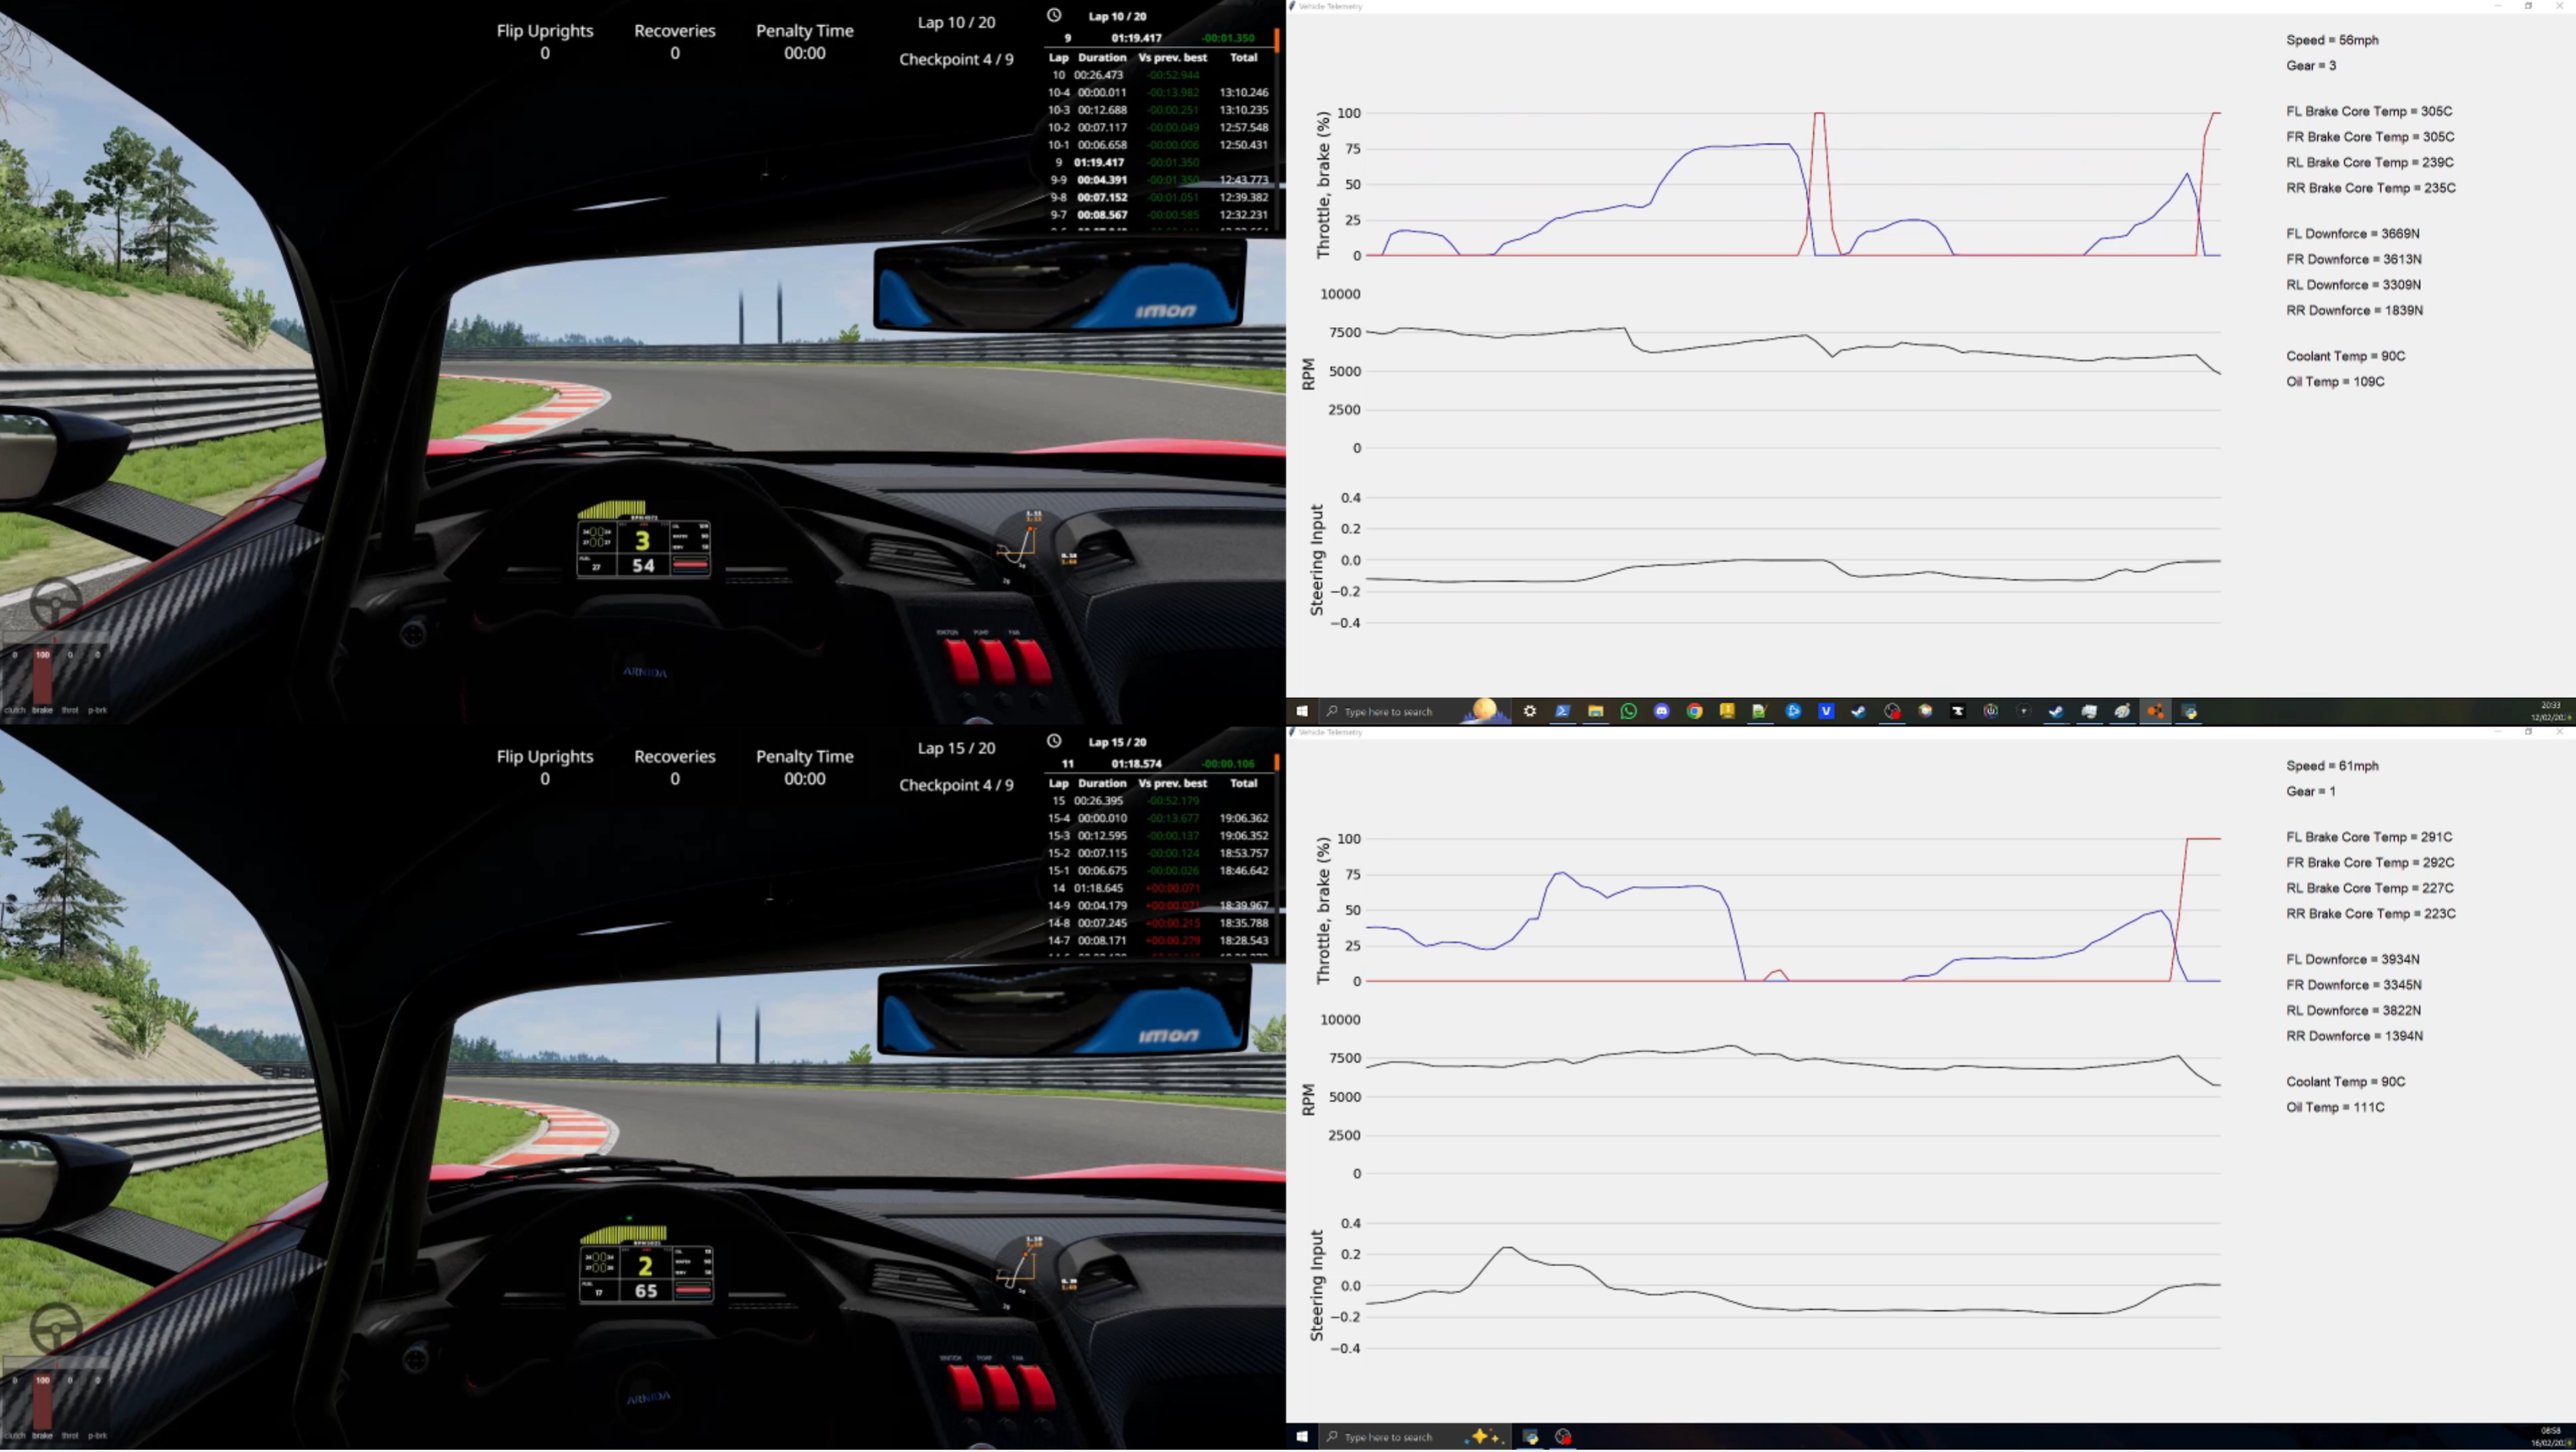
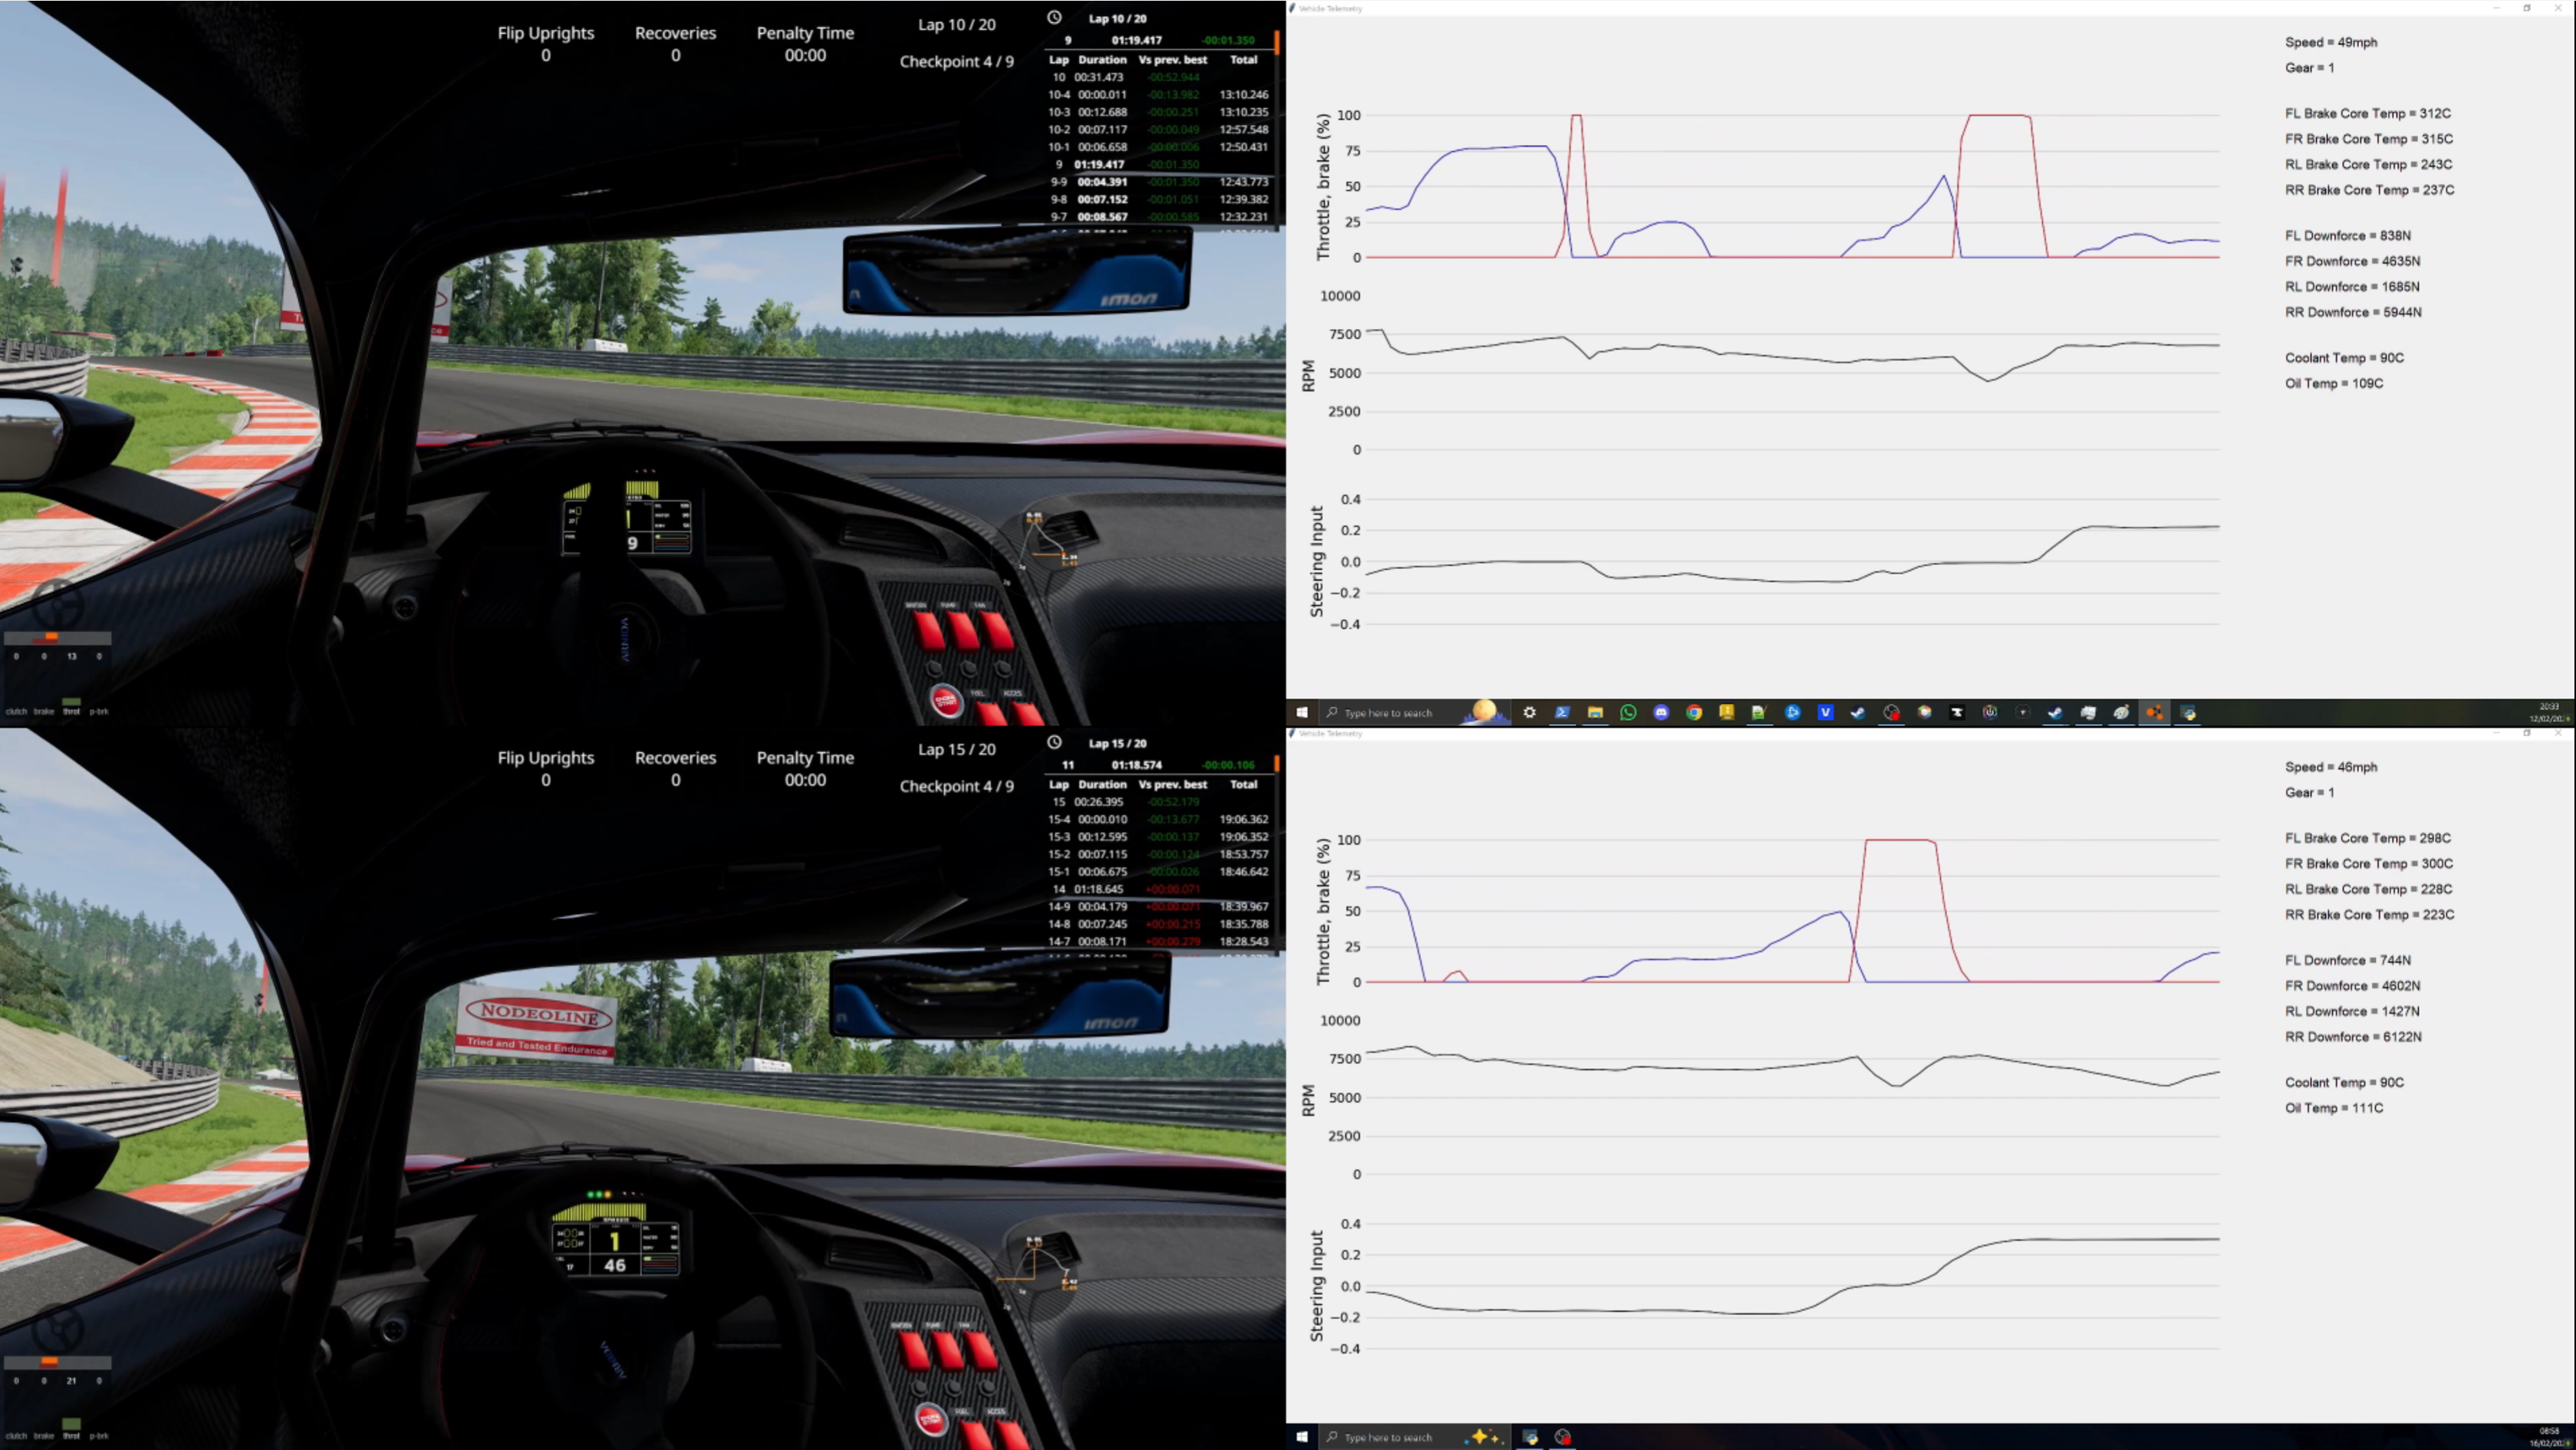
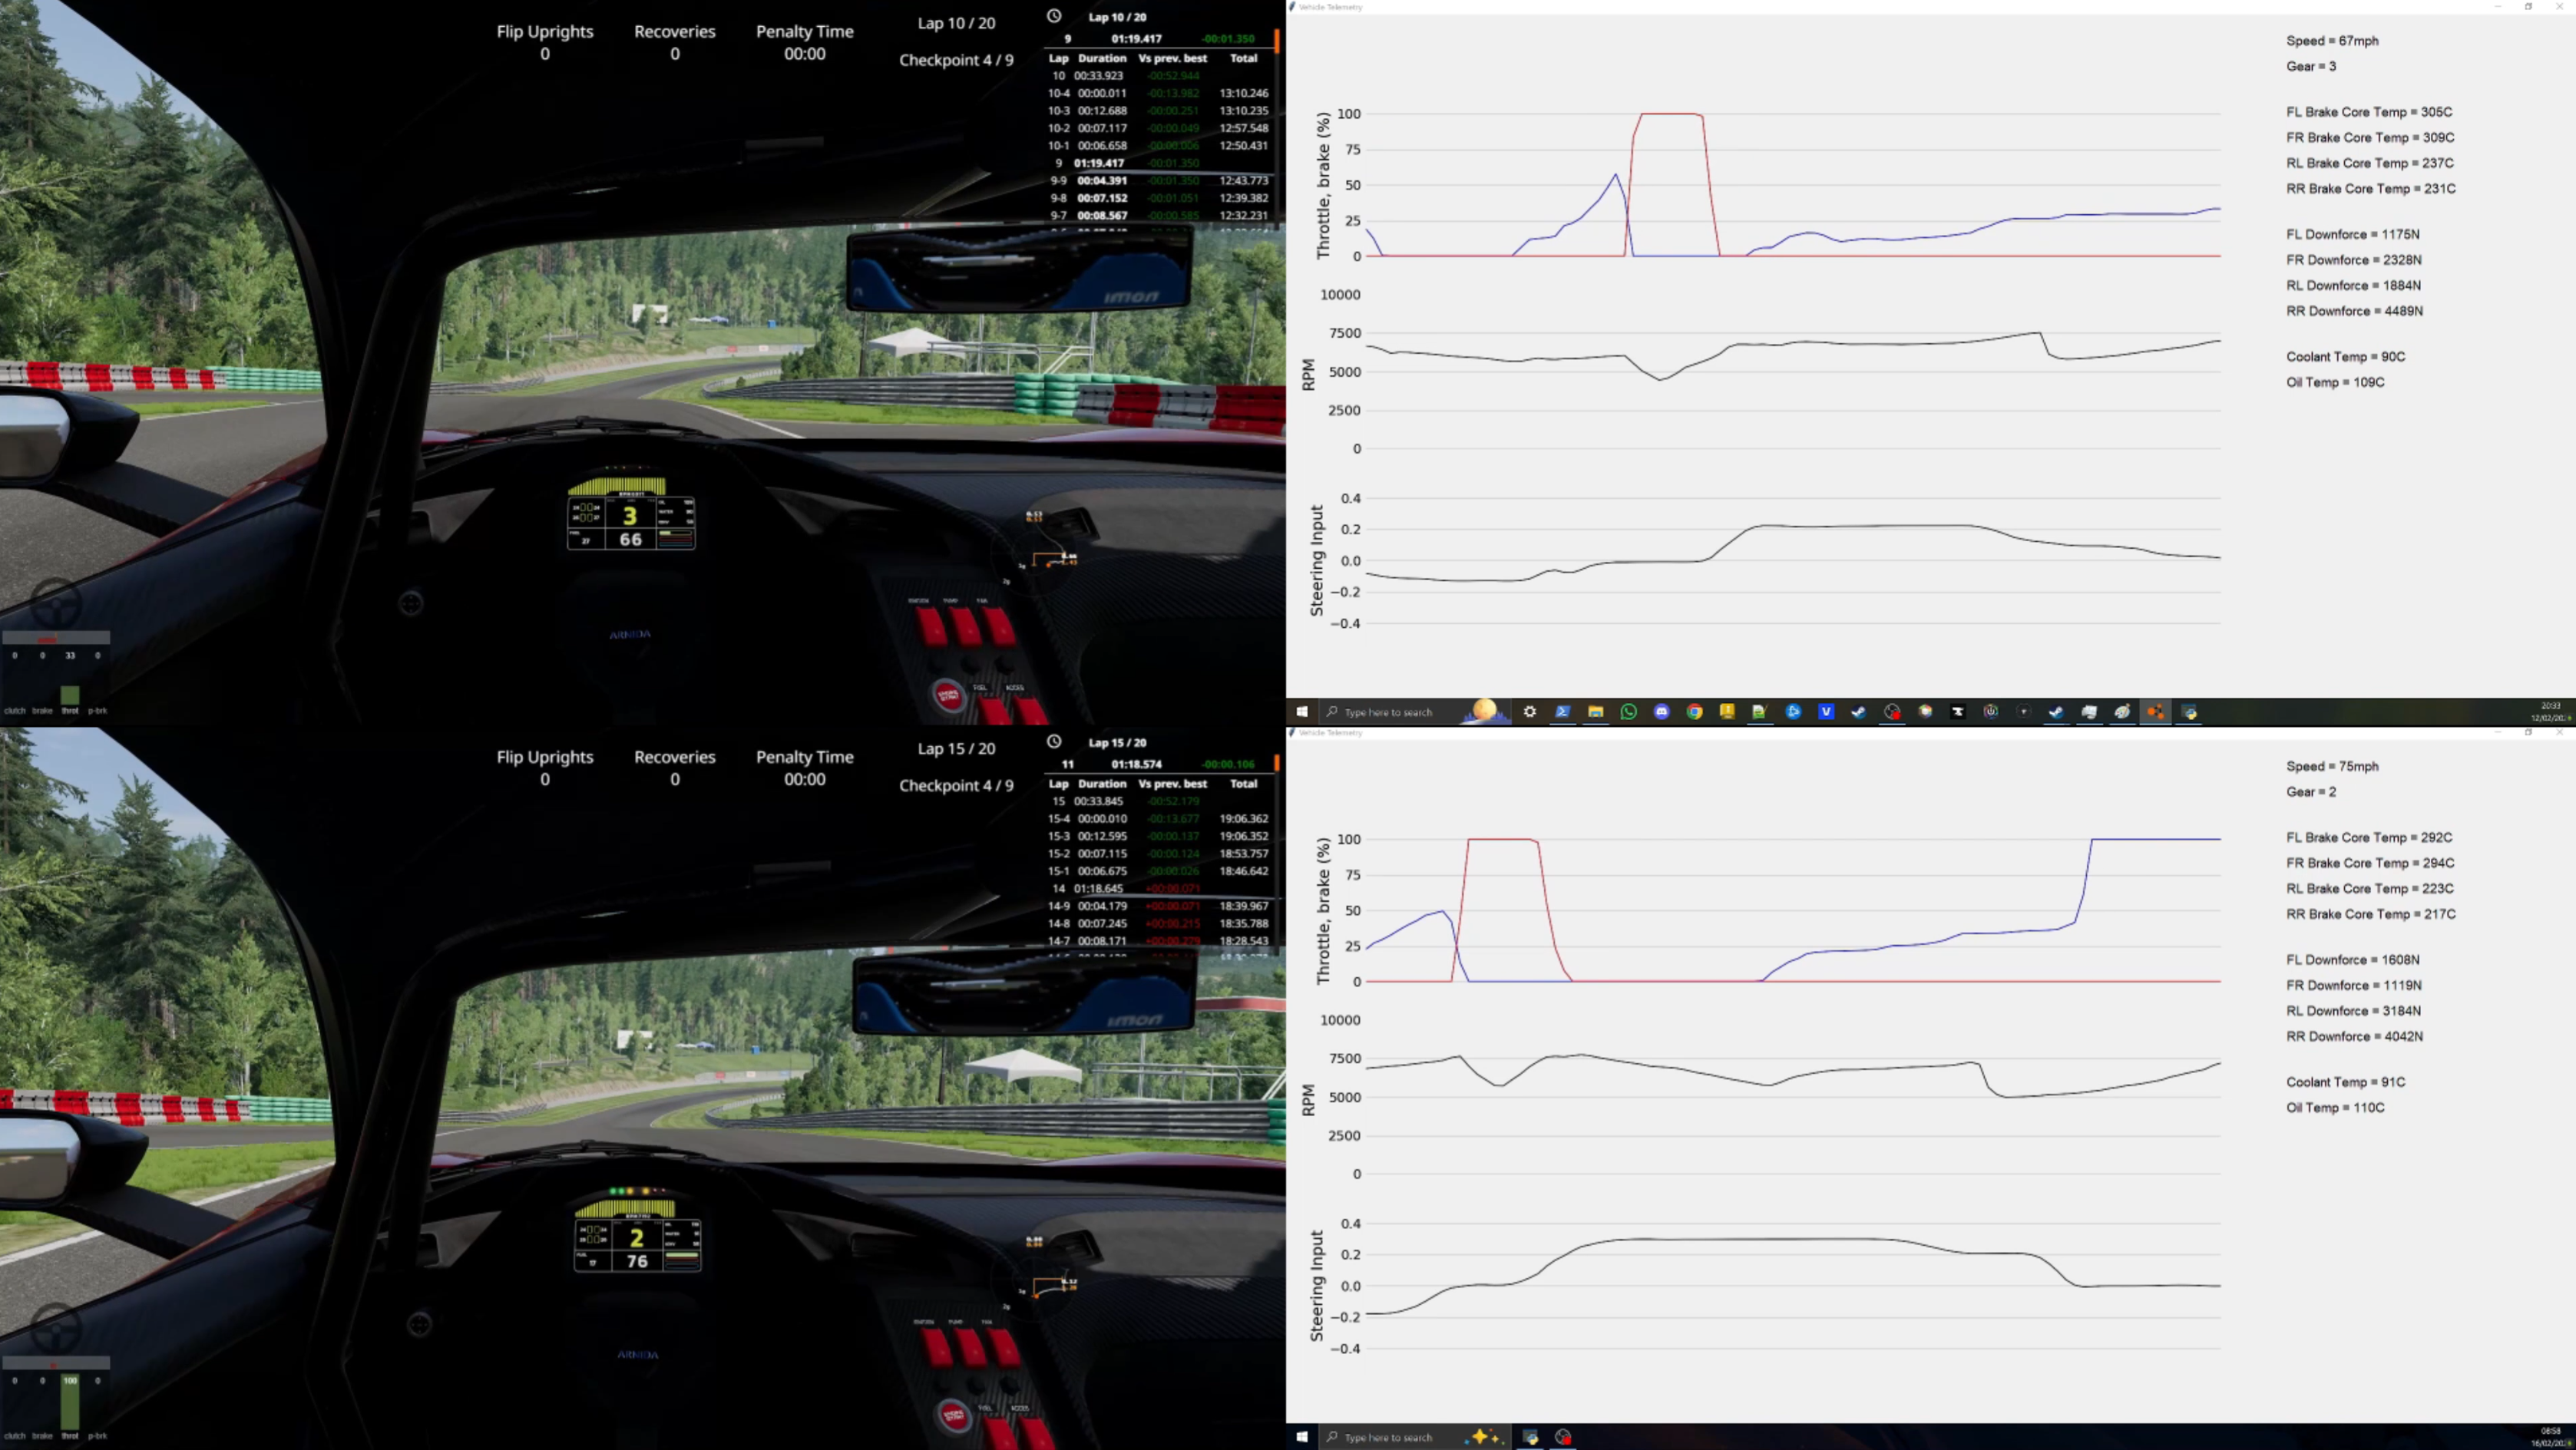
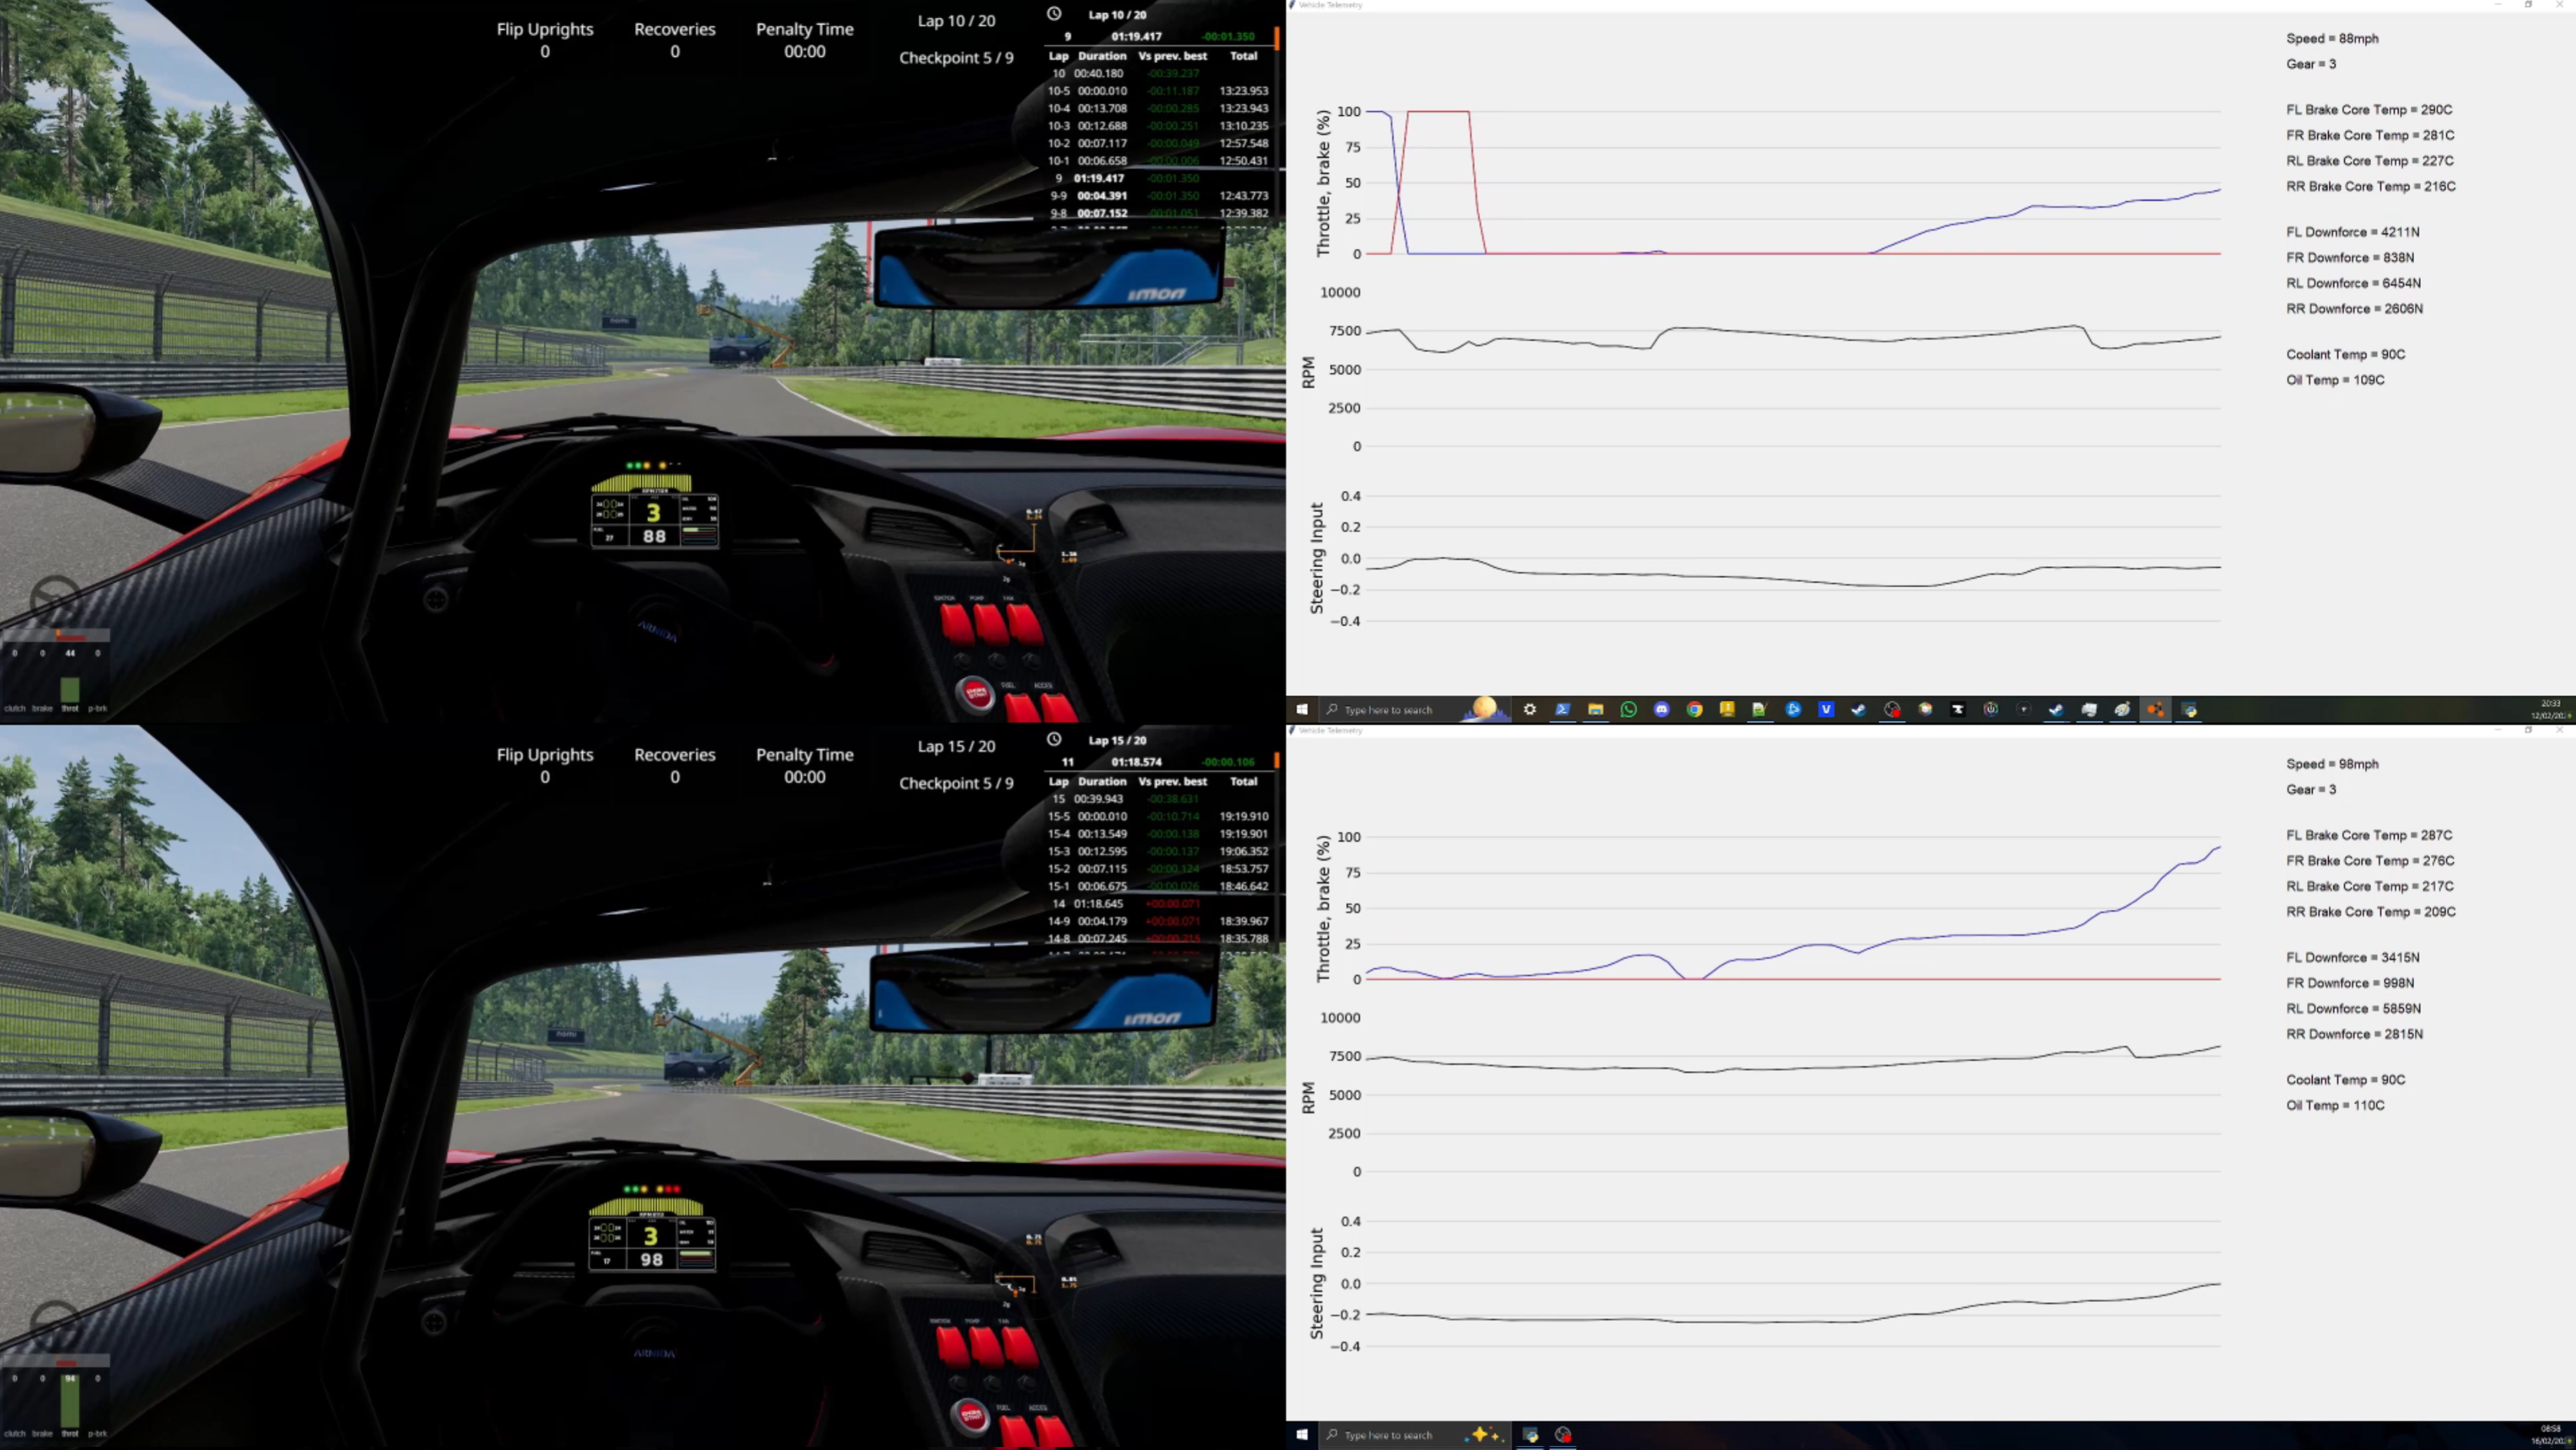
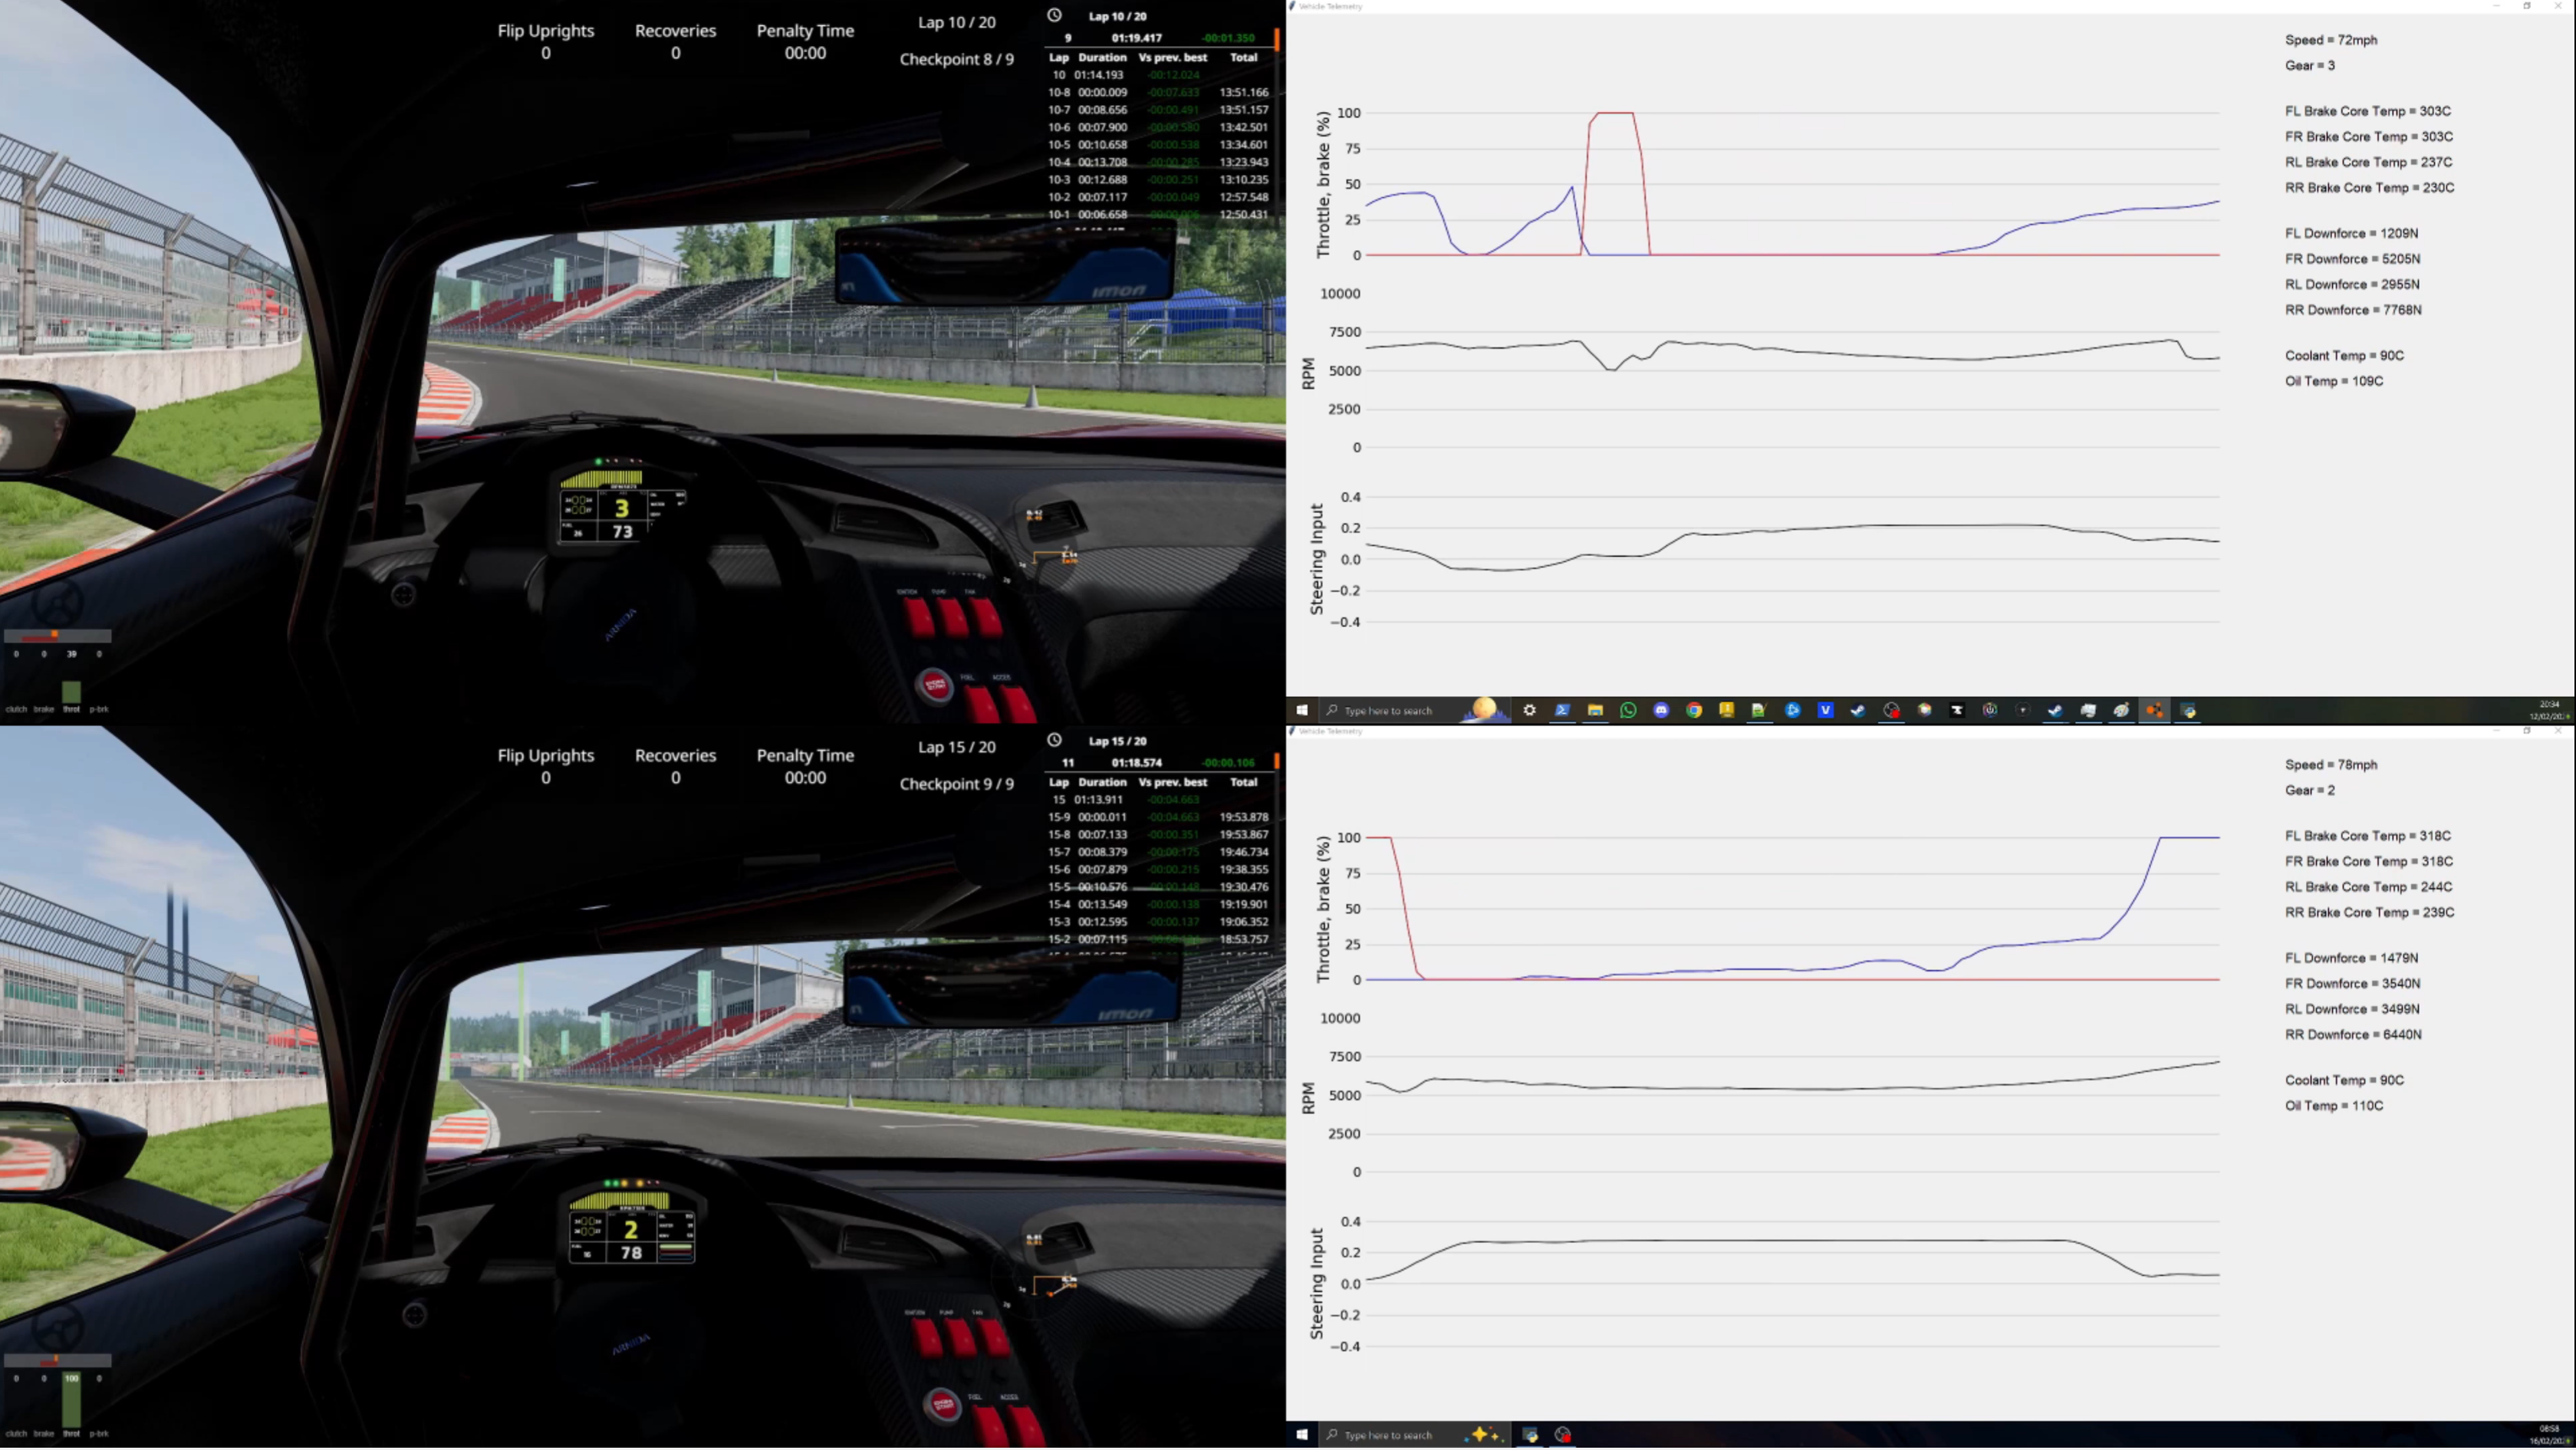
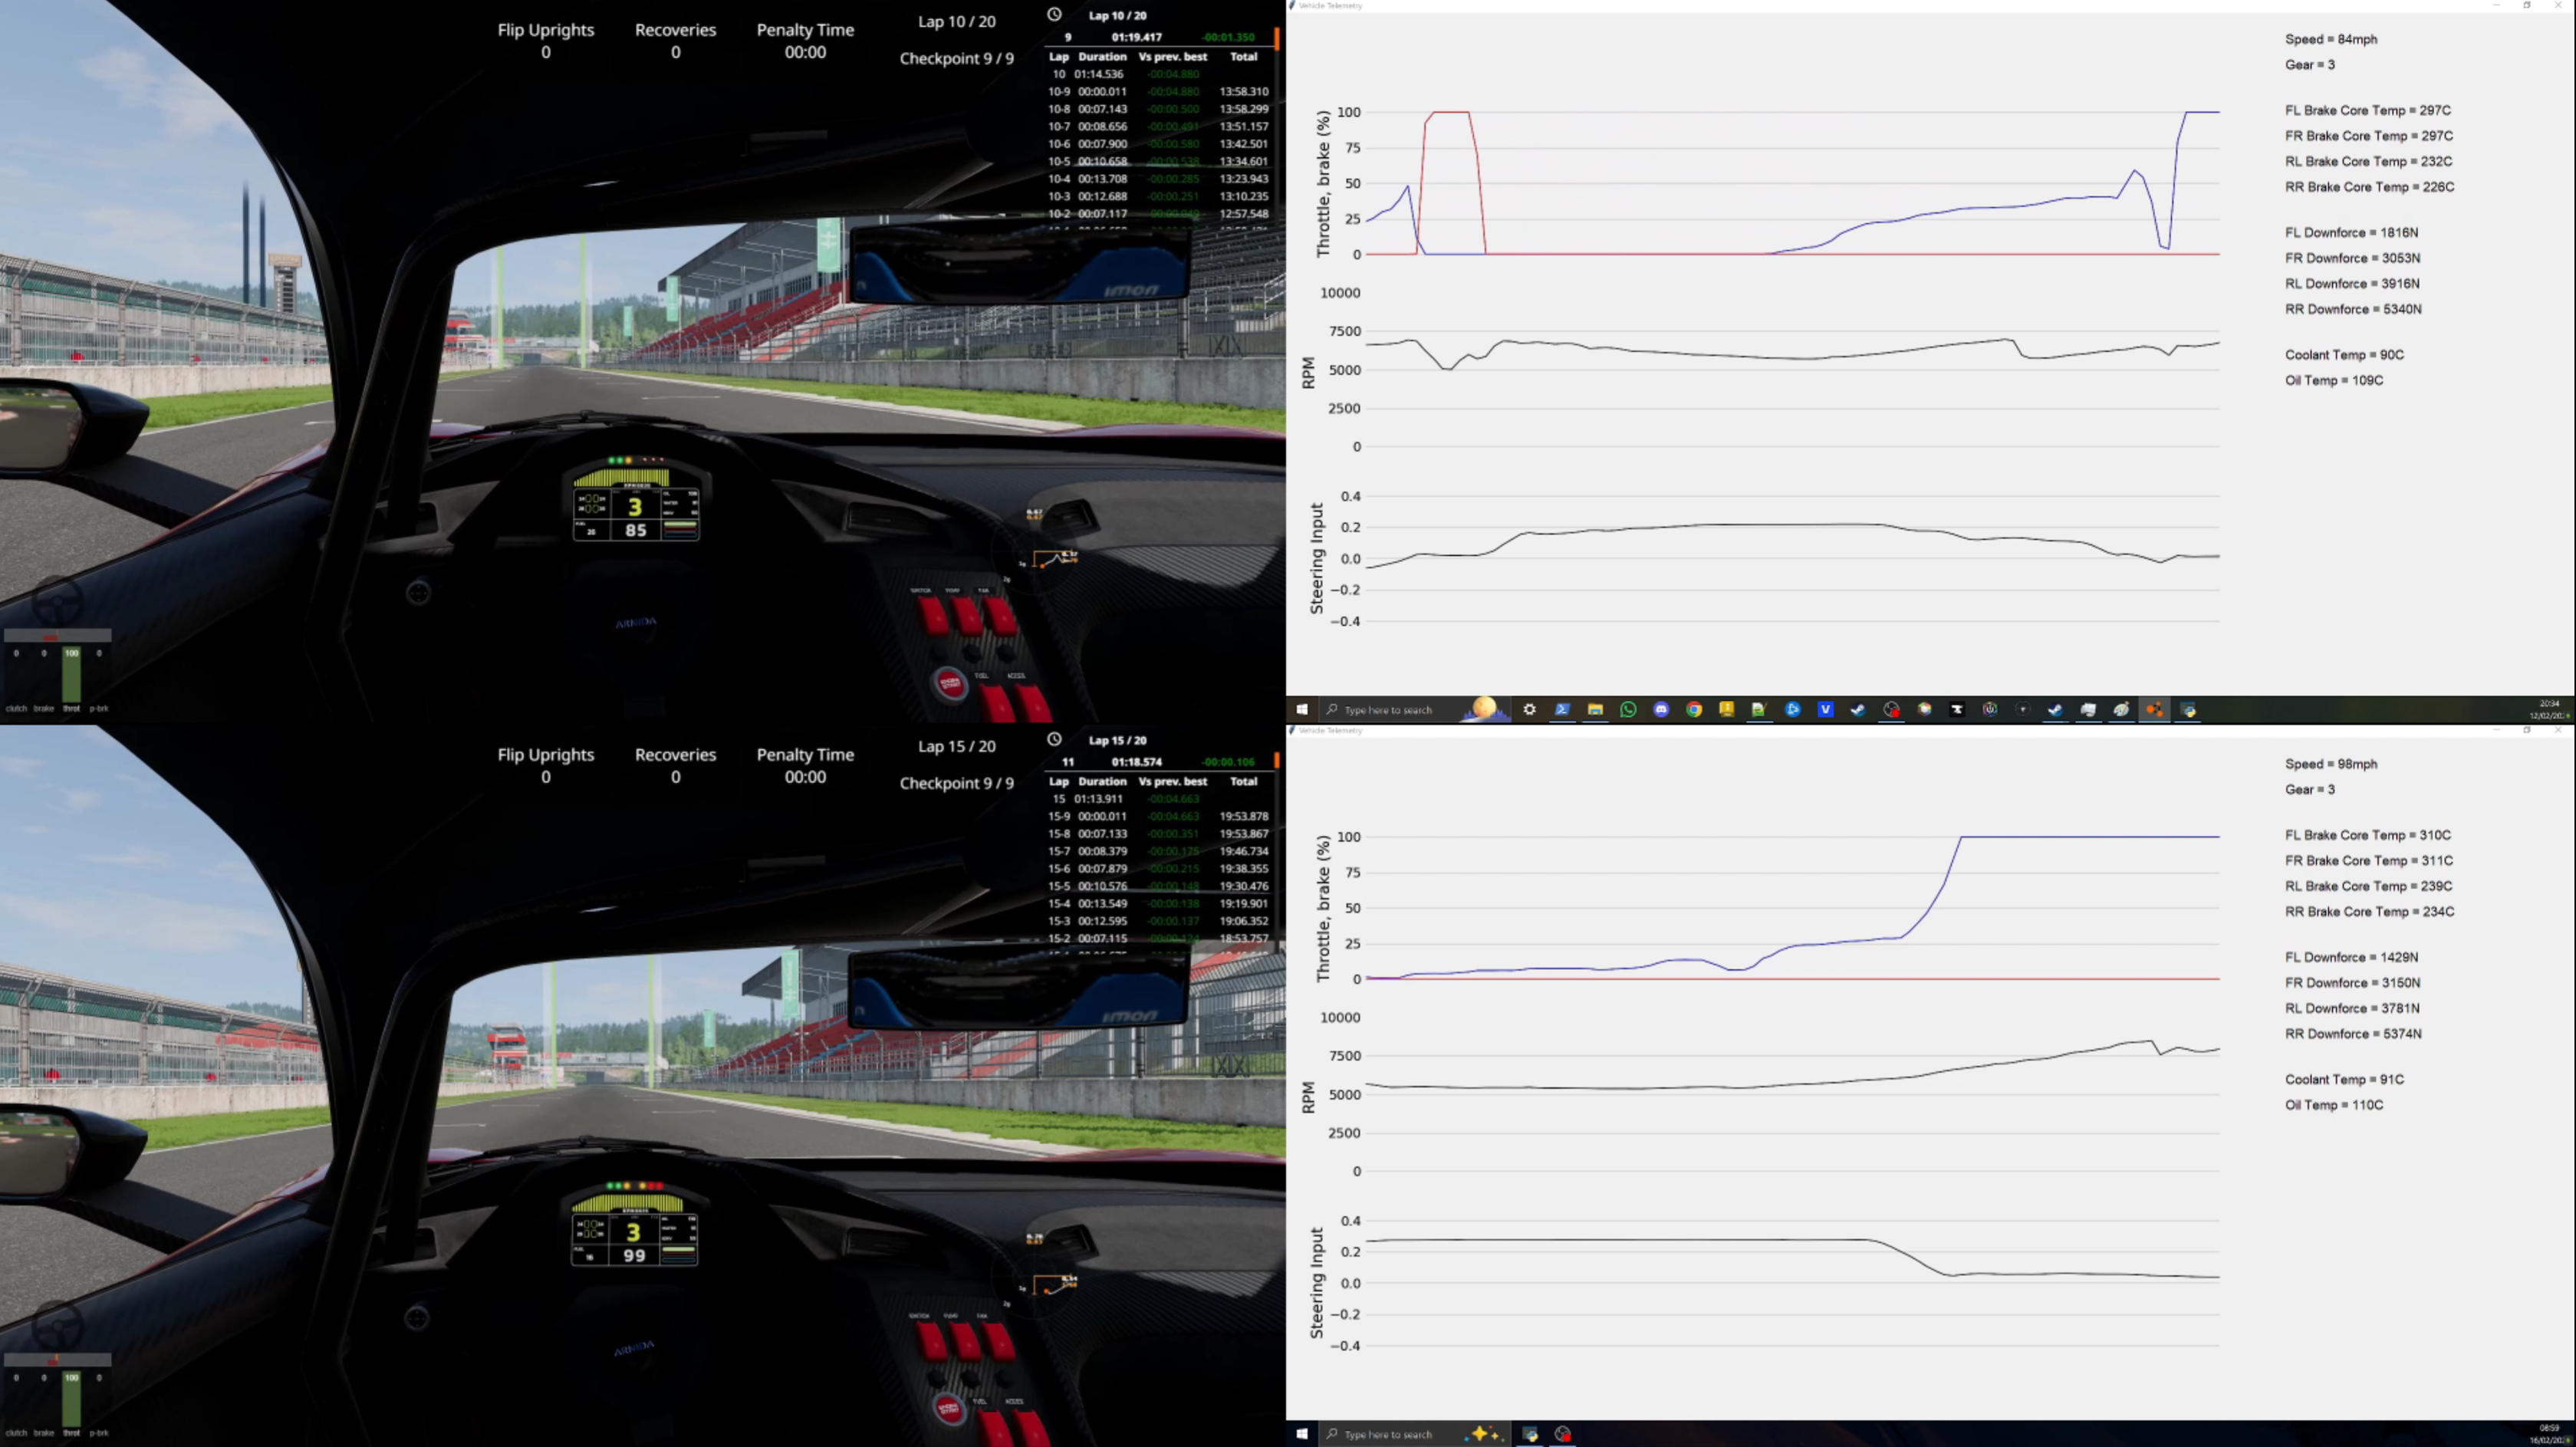
Top is pre-tune lap and bottom is post-tune lap.
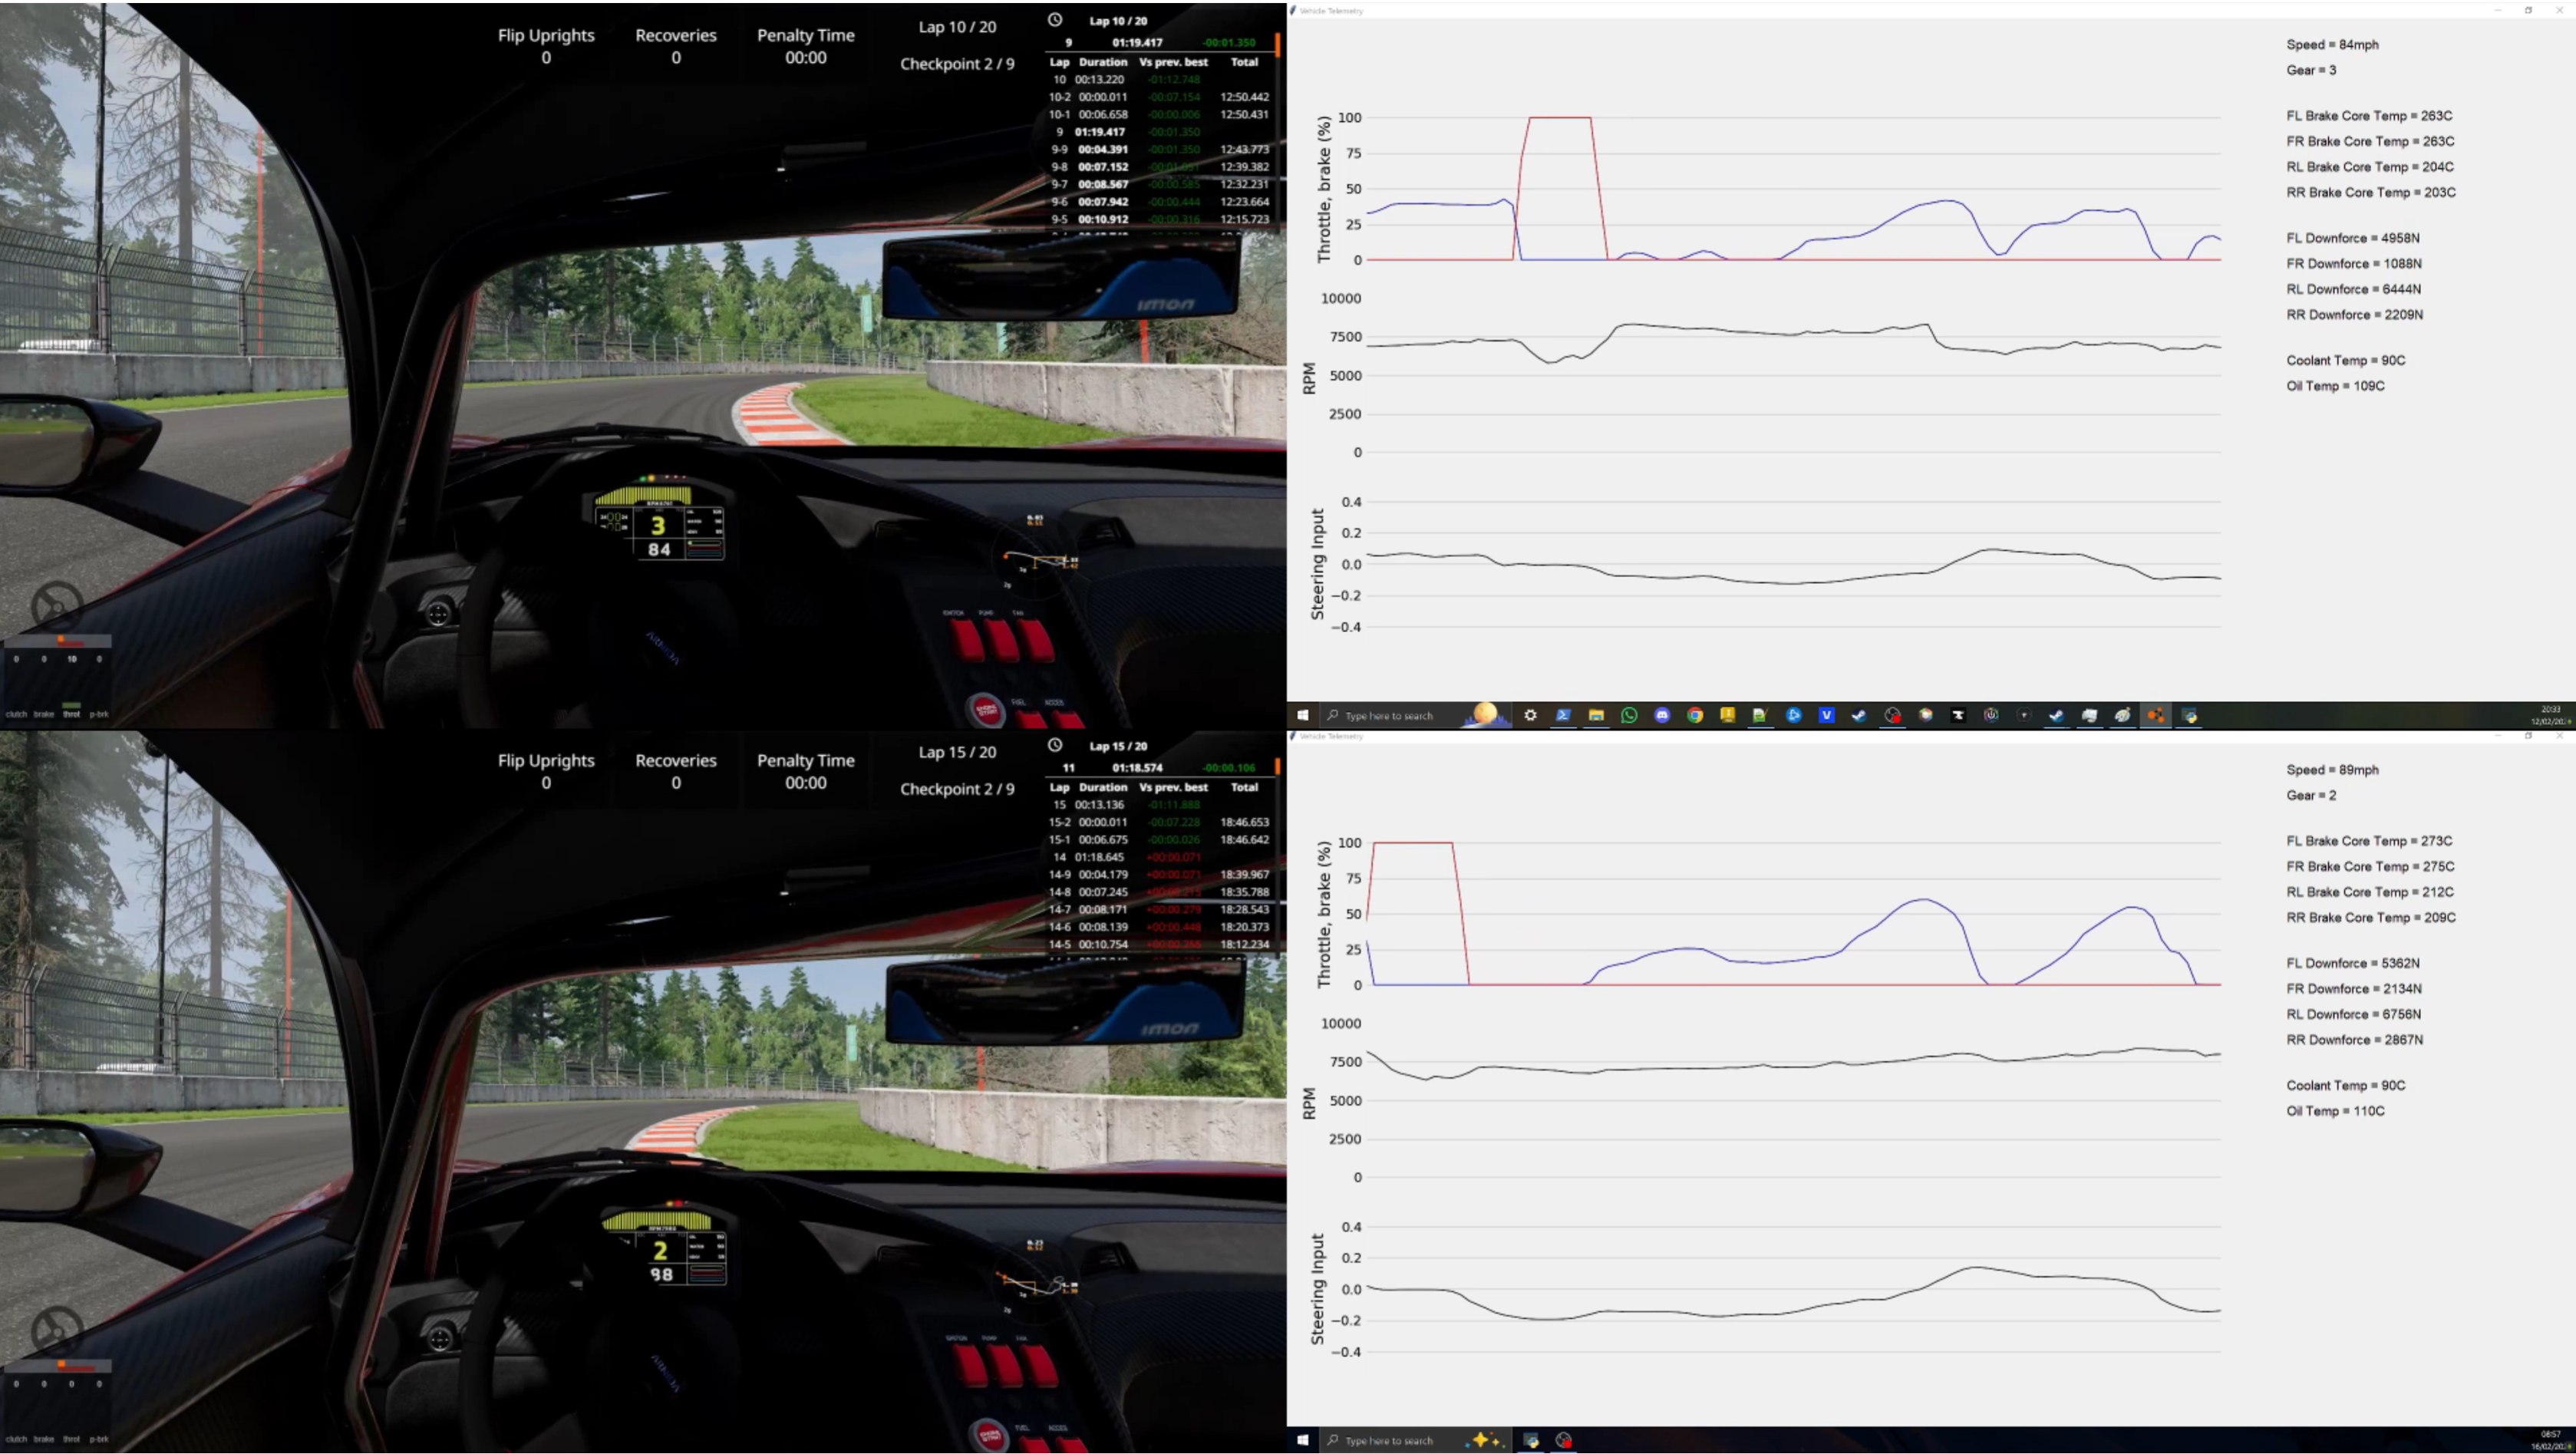
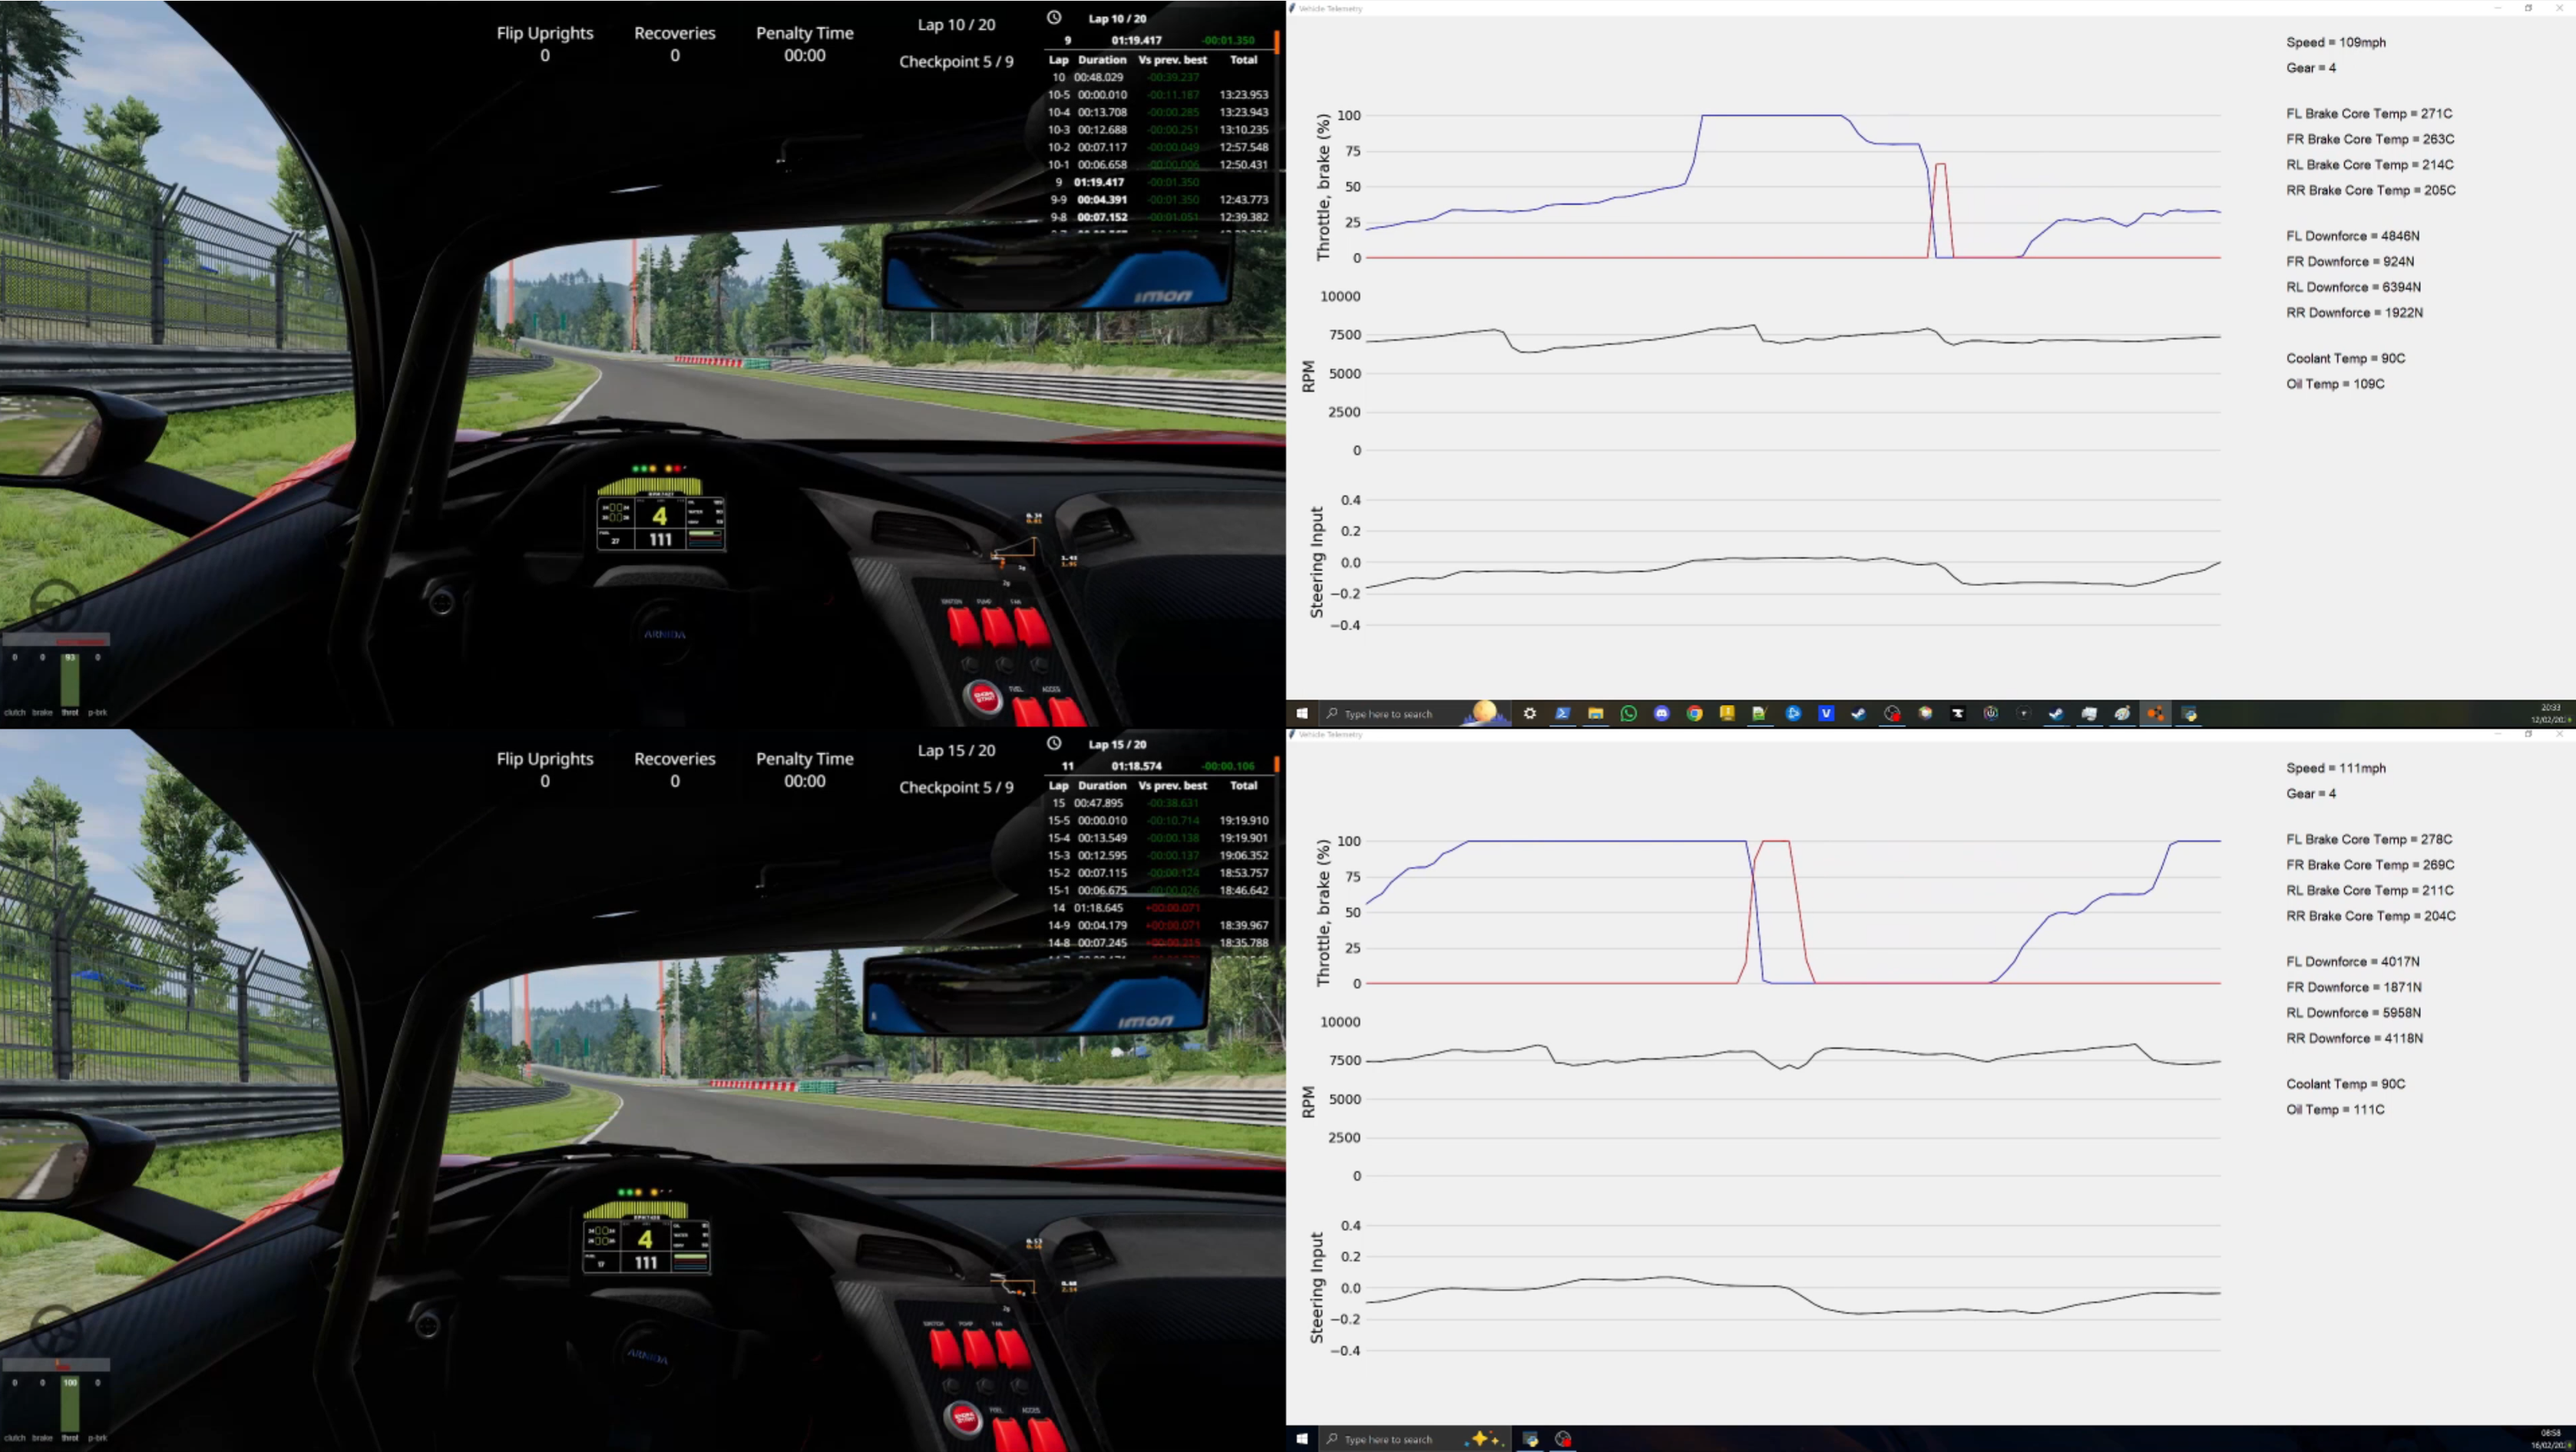
Turn 1
I braked at roughly the same point on each lap. Despite many attempts, there’s still time to be found here. I expected the car to hold ~100 mph through the corner, but with both setups, it struggled to stay tight to the kerbs. With setup 2, I had to ease off the throttle slightly to allow more rotation and keep to the kerb. With setup 1, I was more hesitant on the throttle (fear of losing control), meaning I carried less speed through the corner.
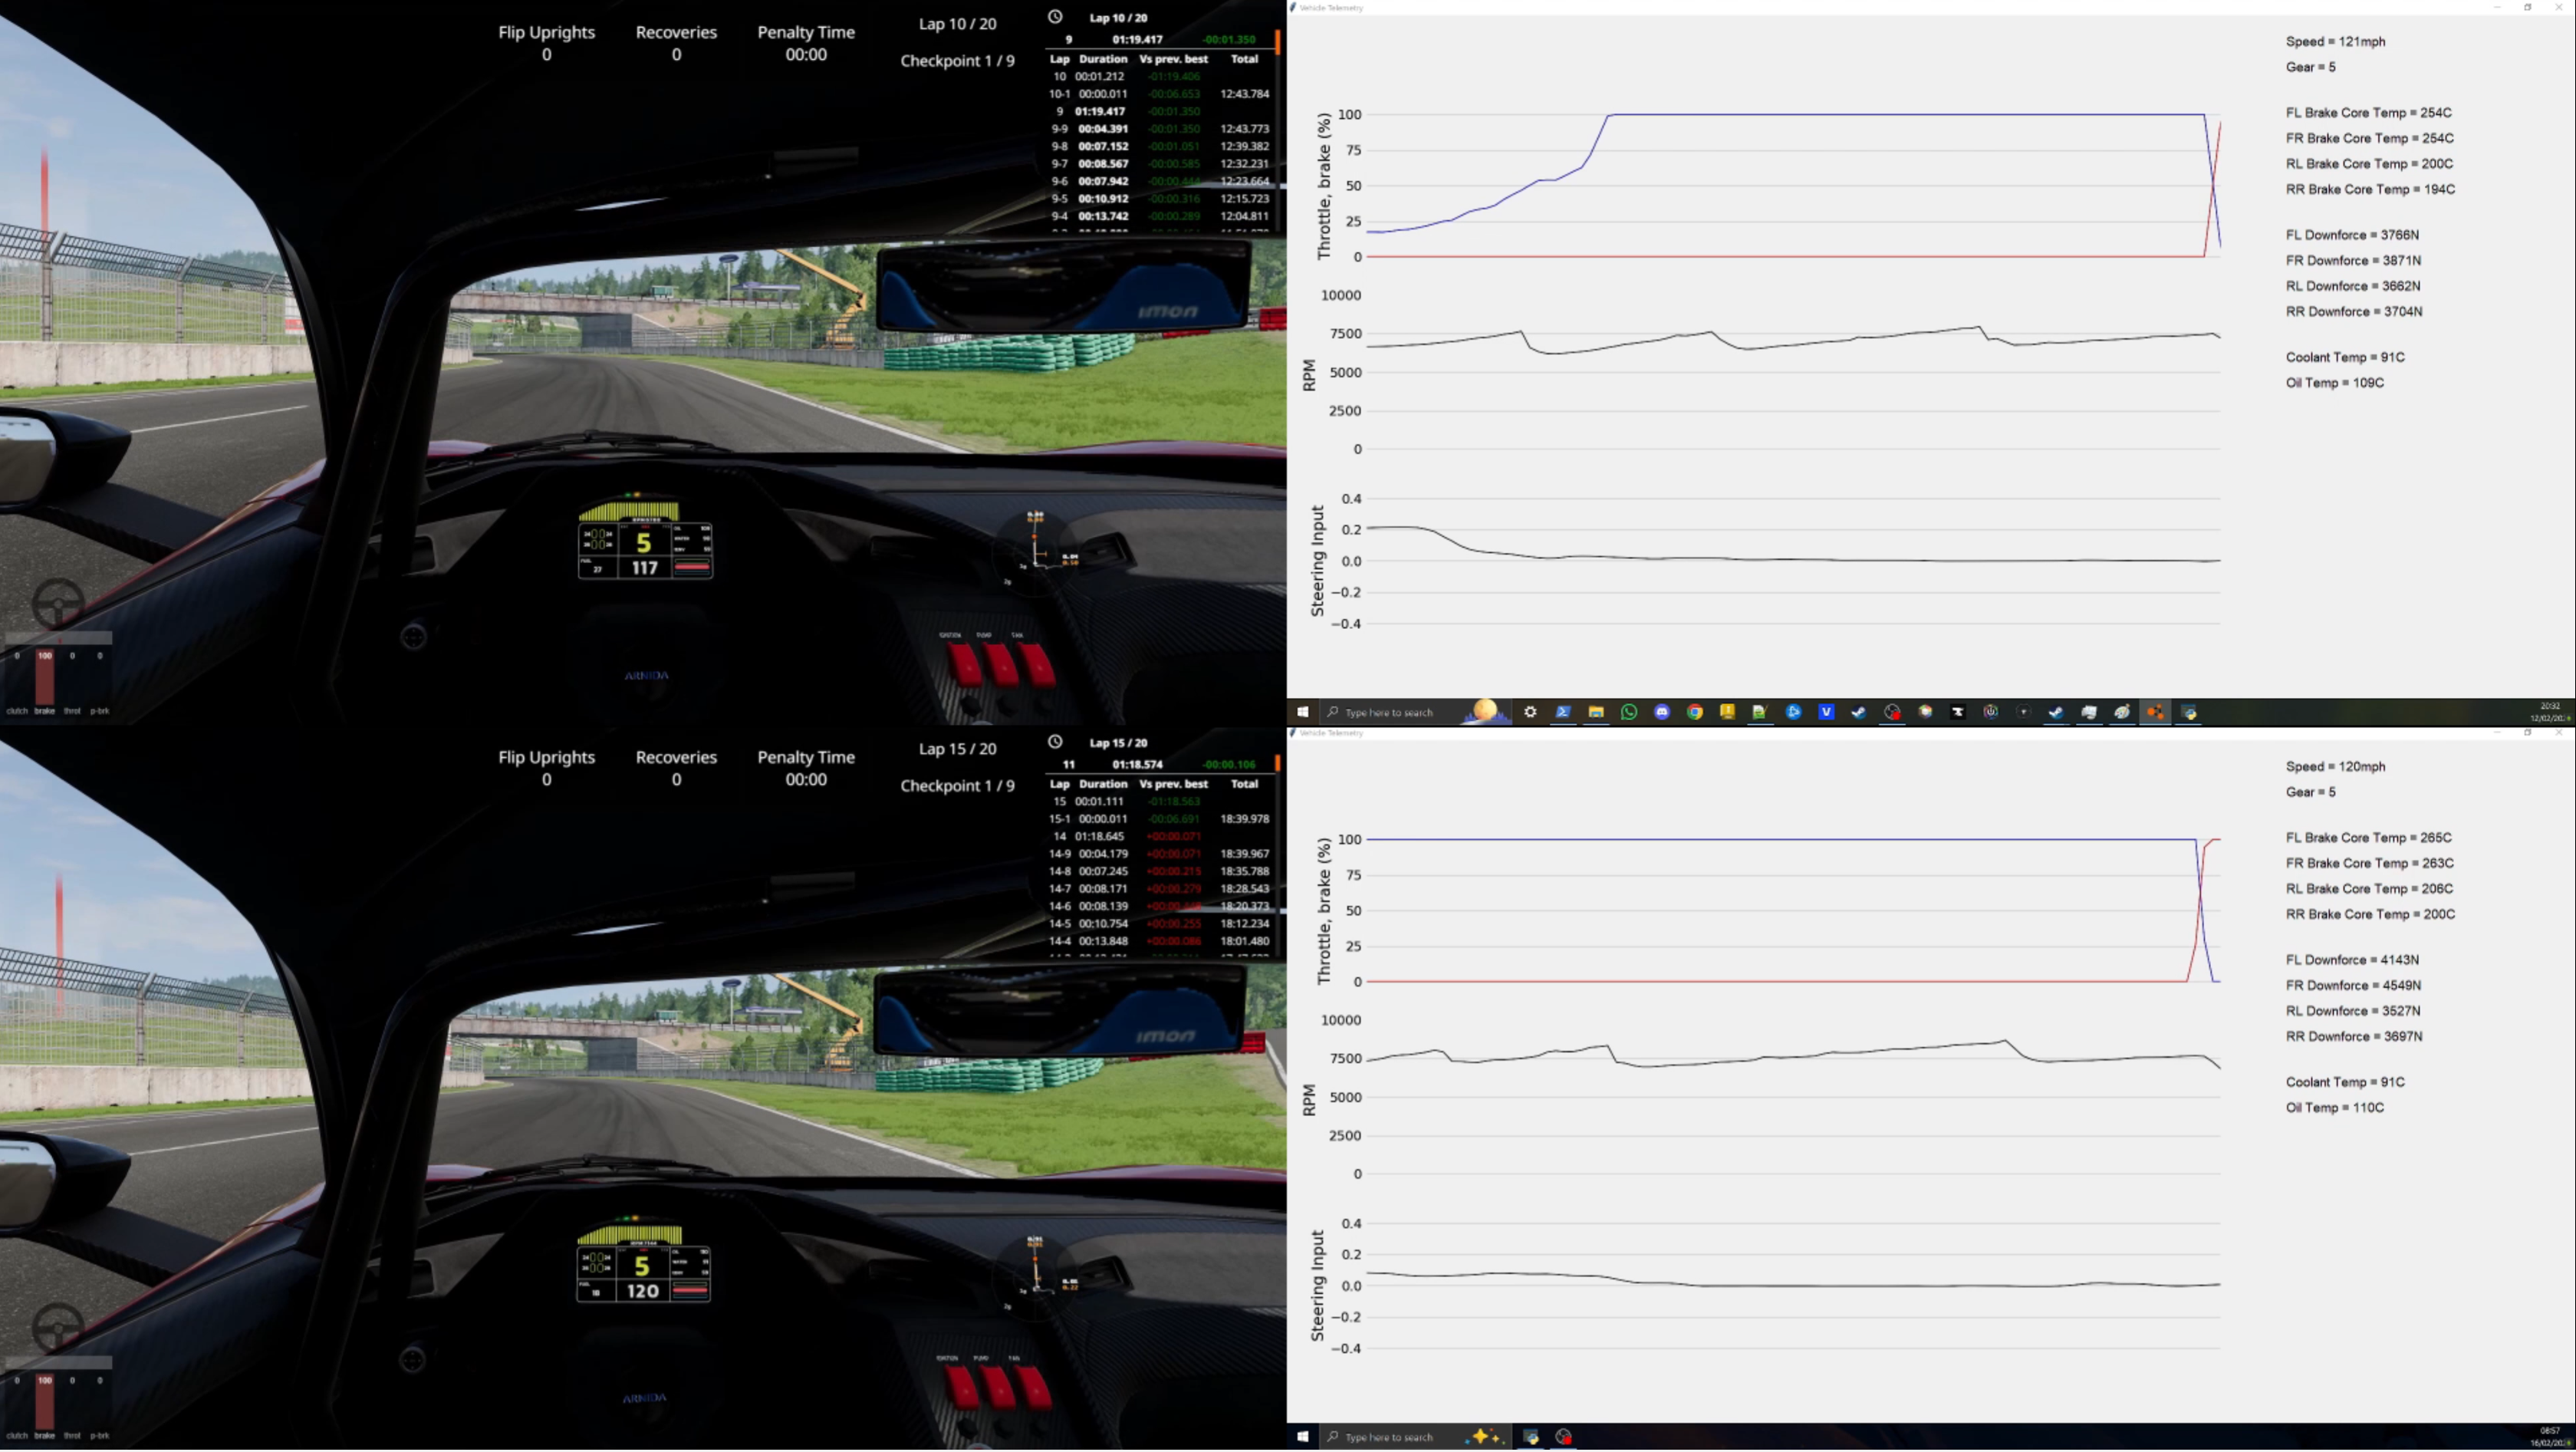
Approach to Turn 1
Going through Turn 1
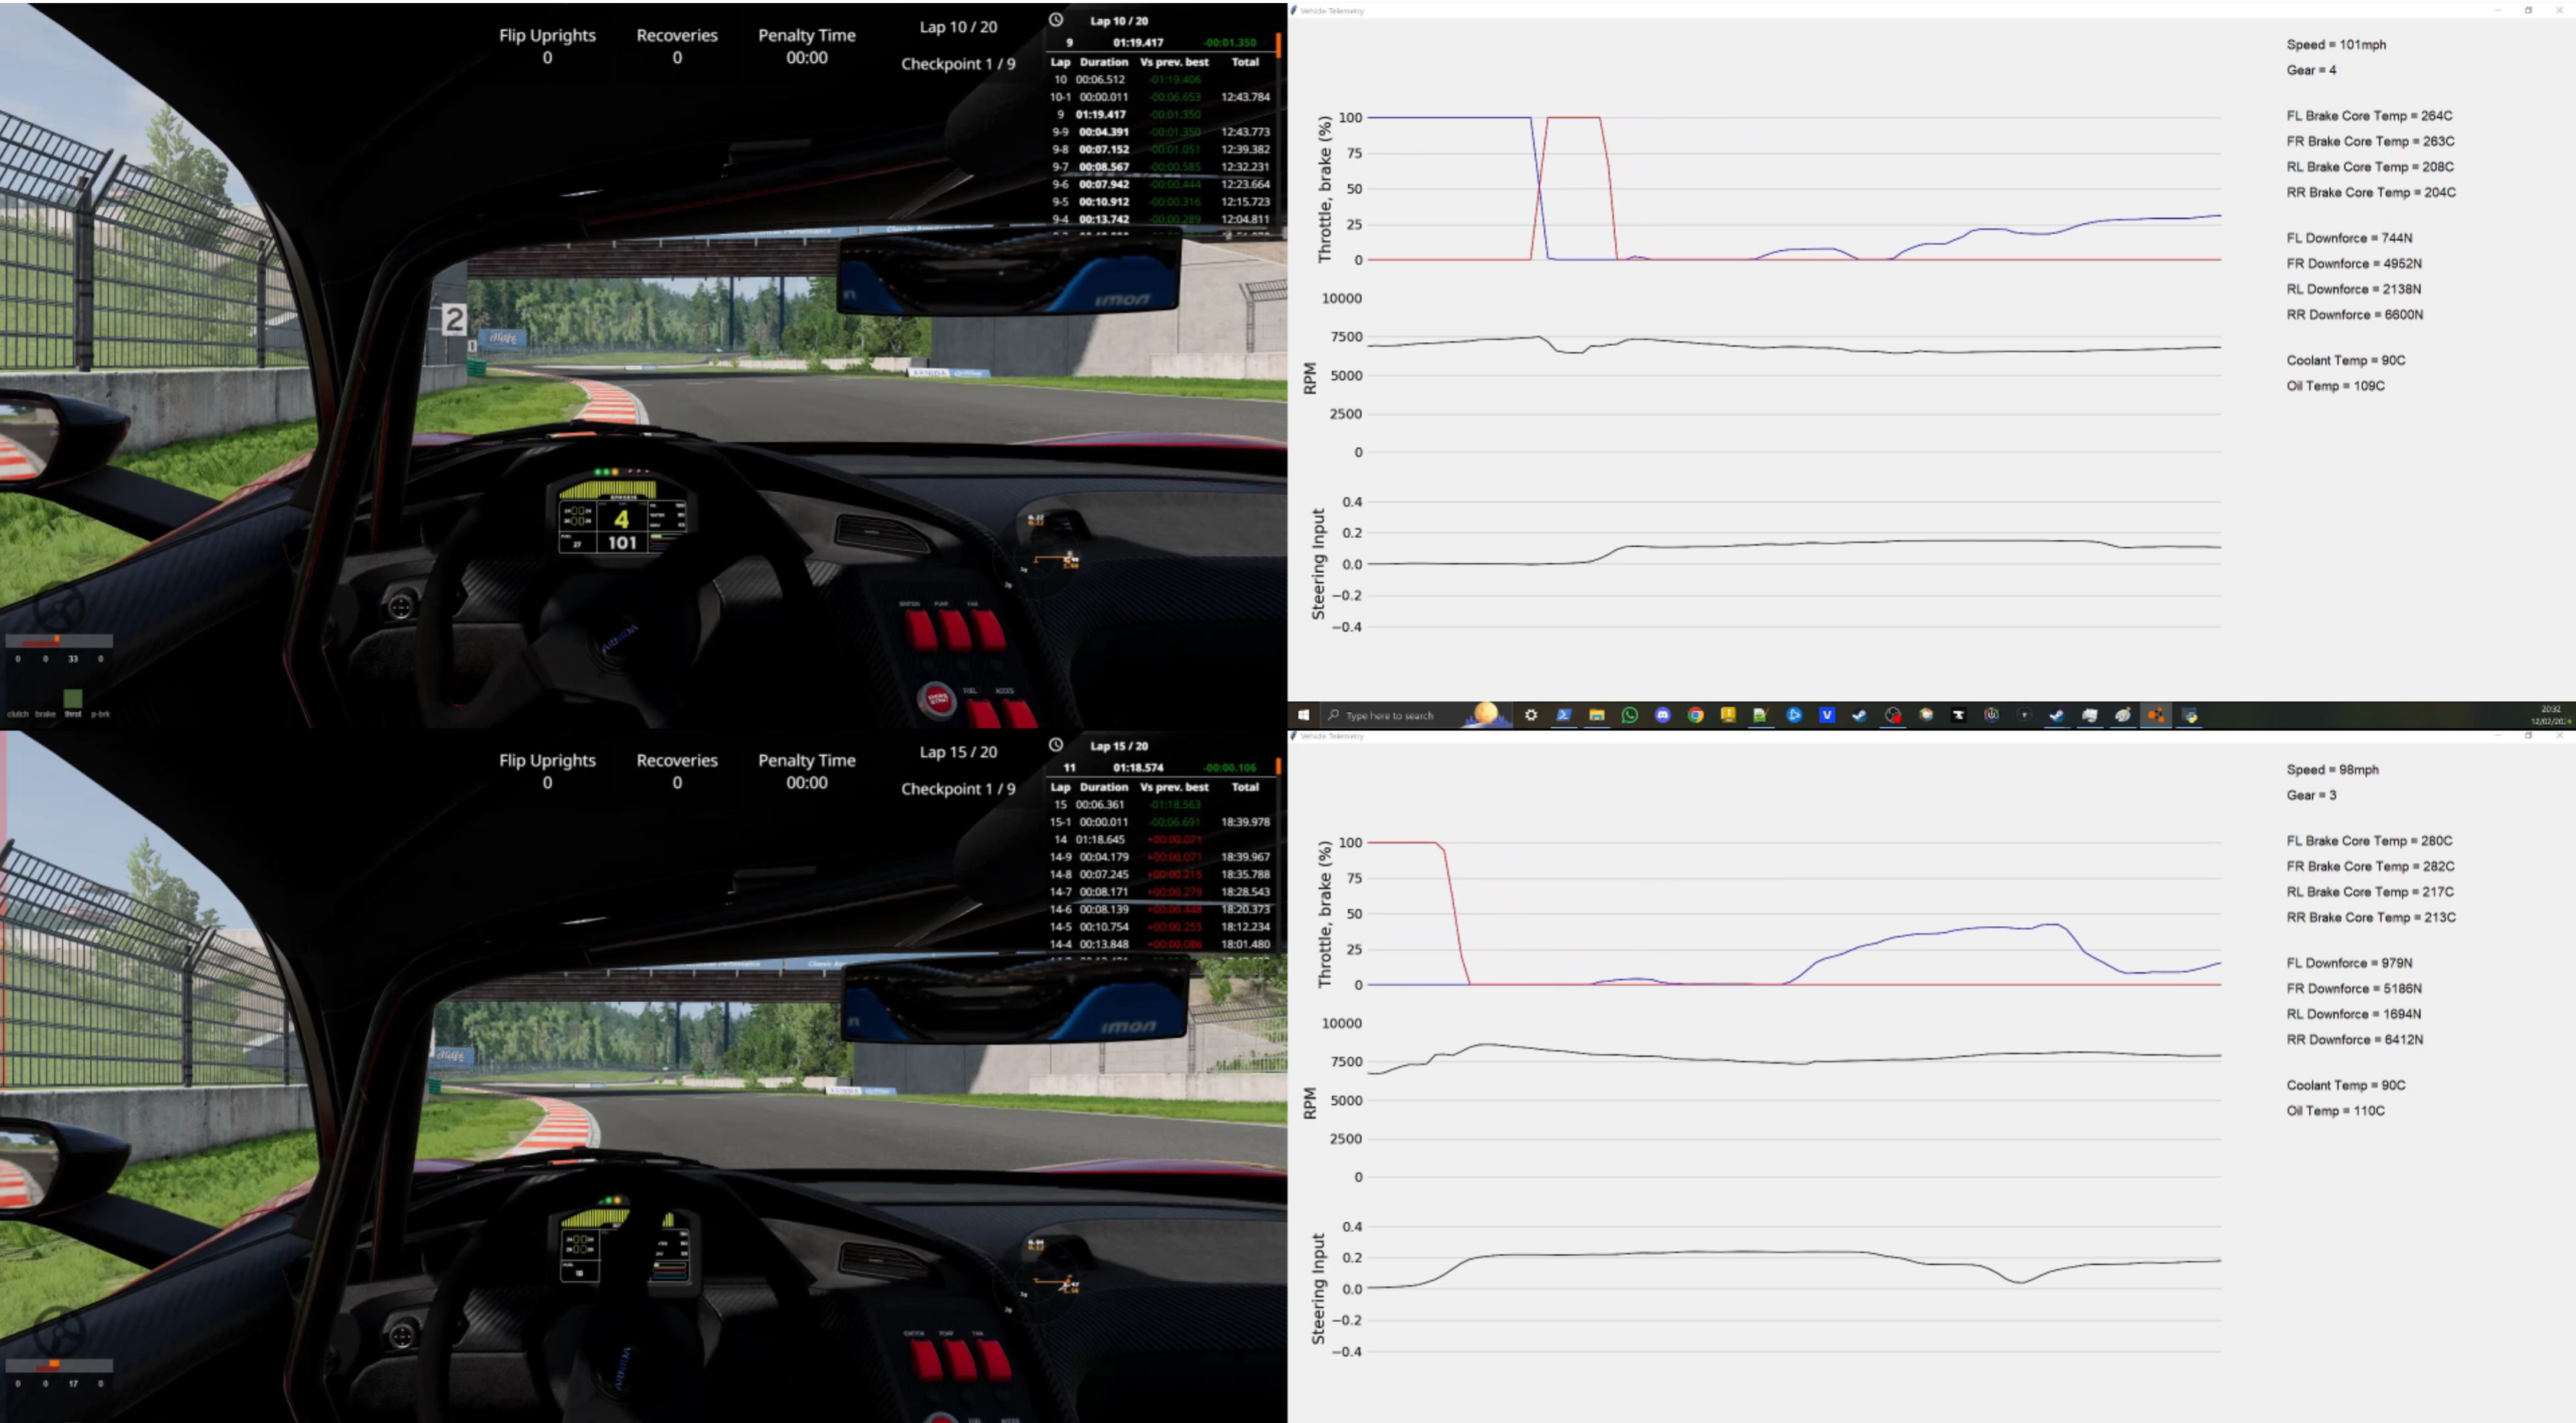
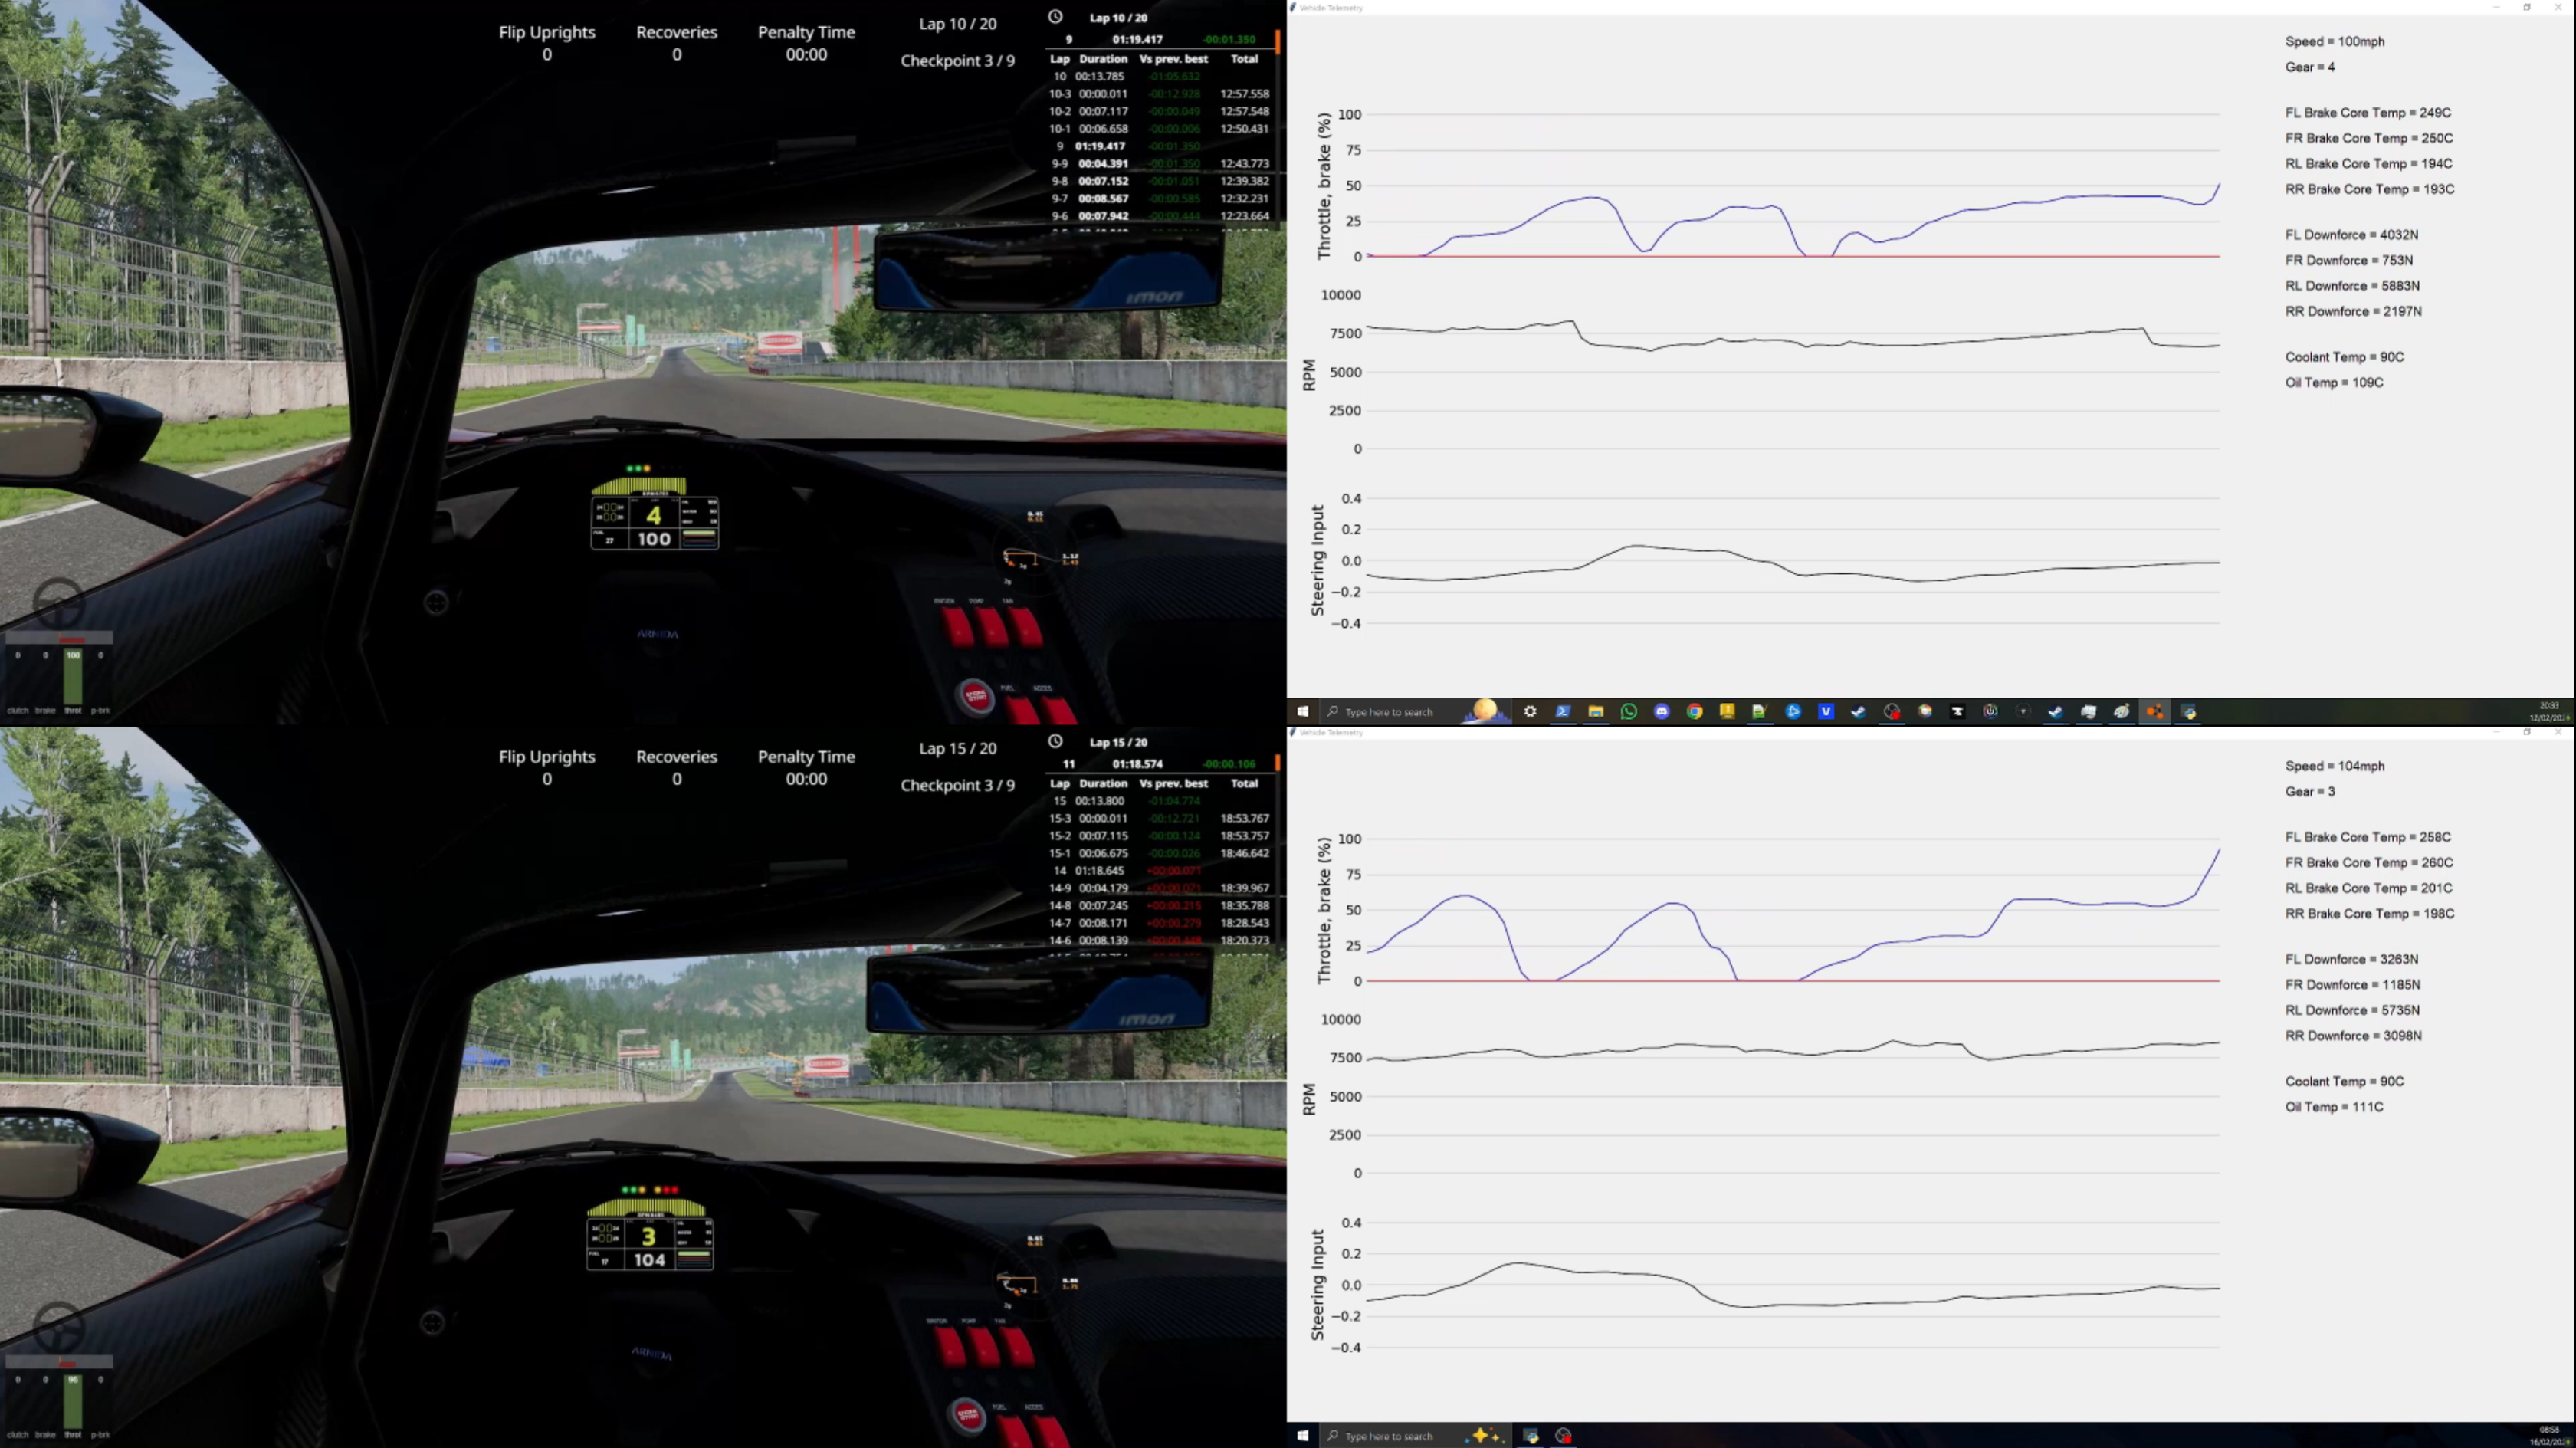
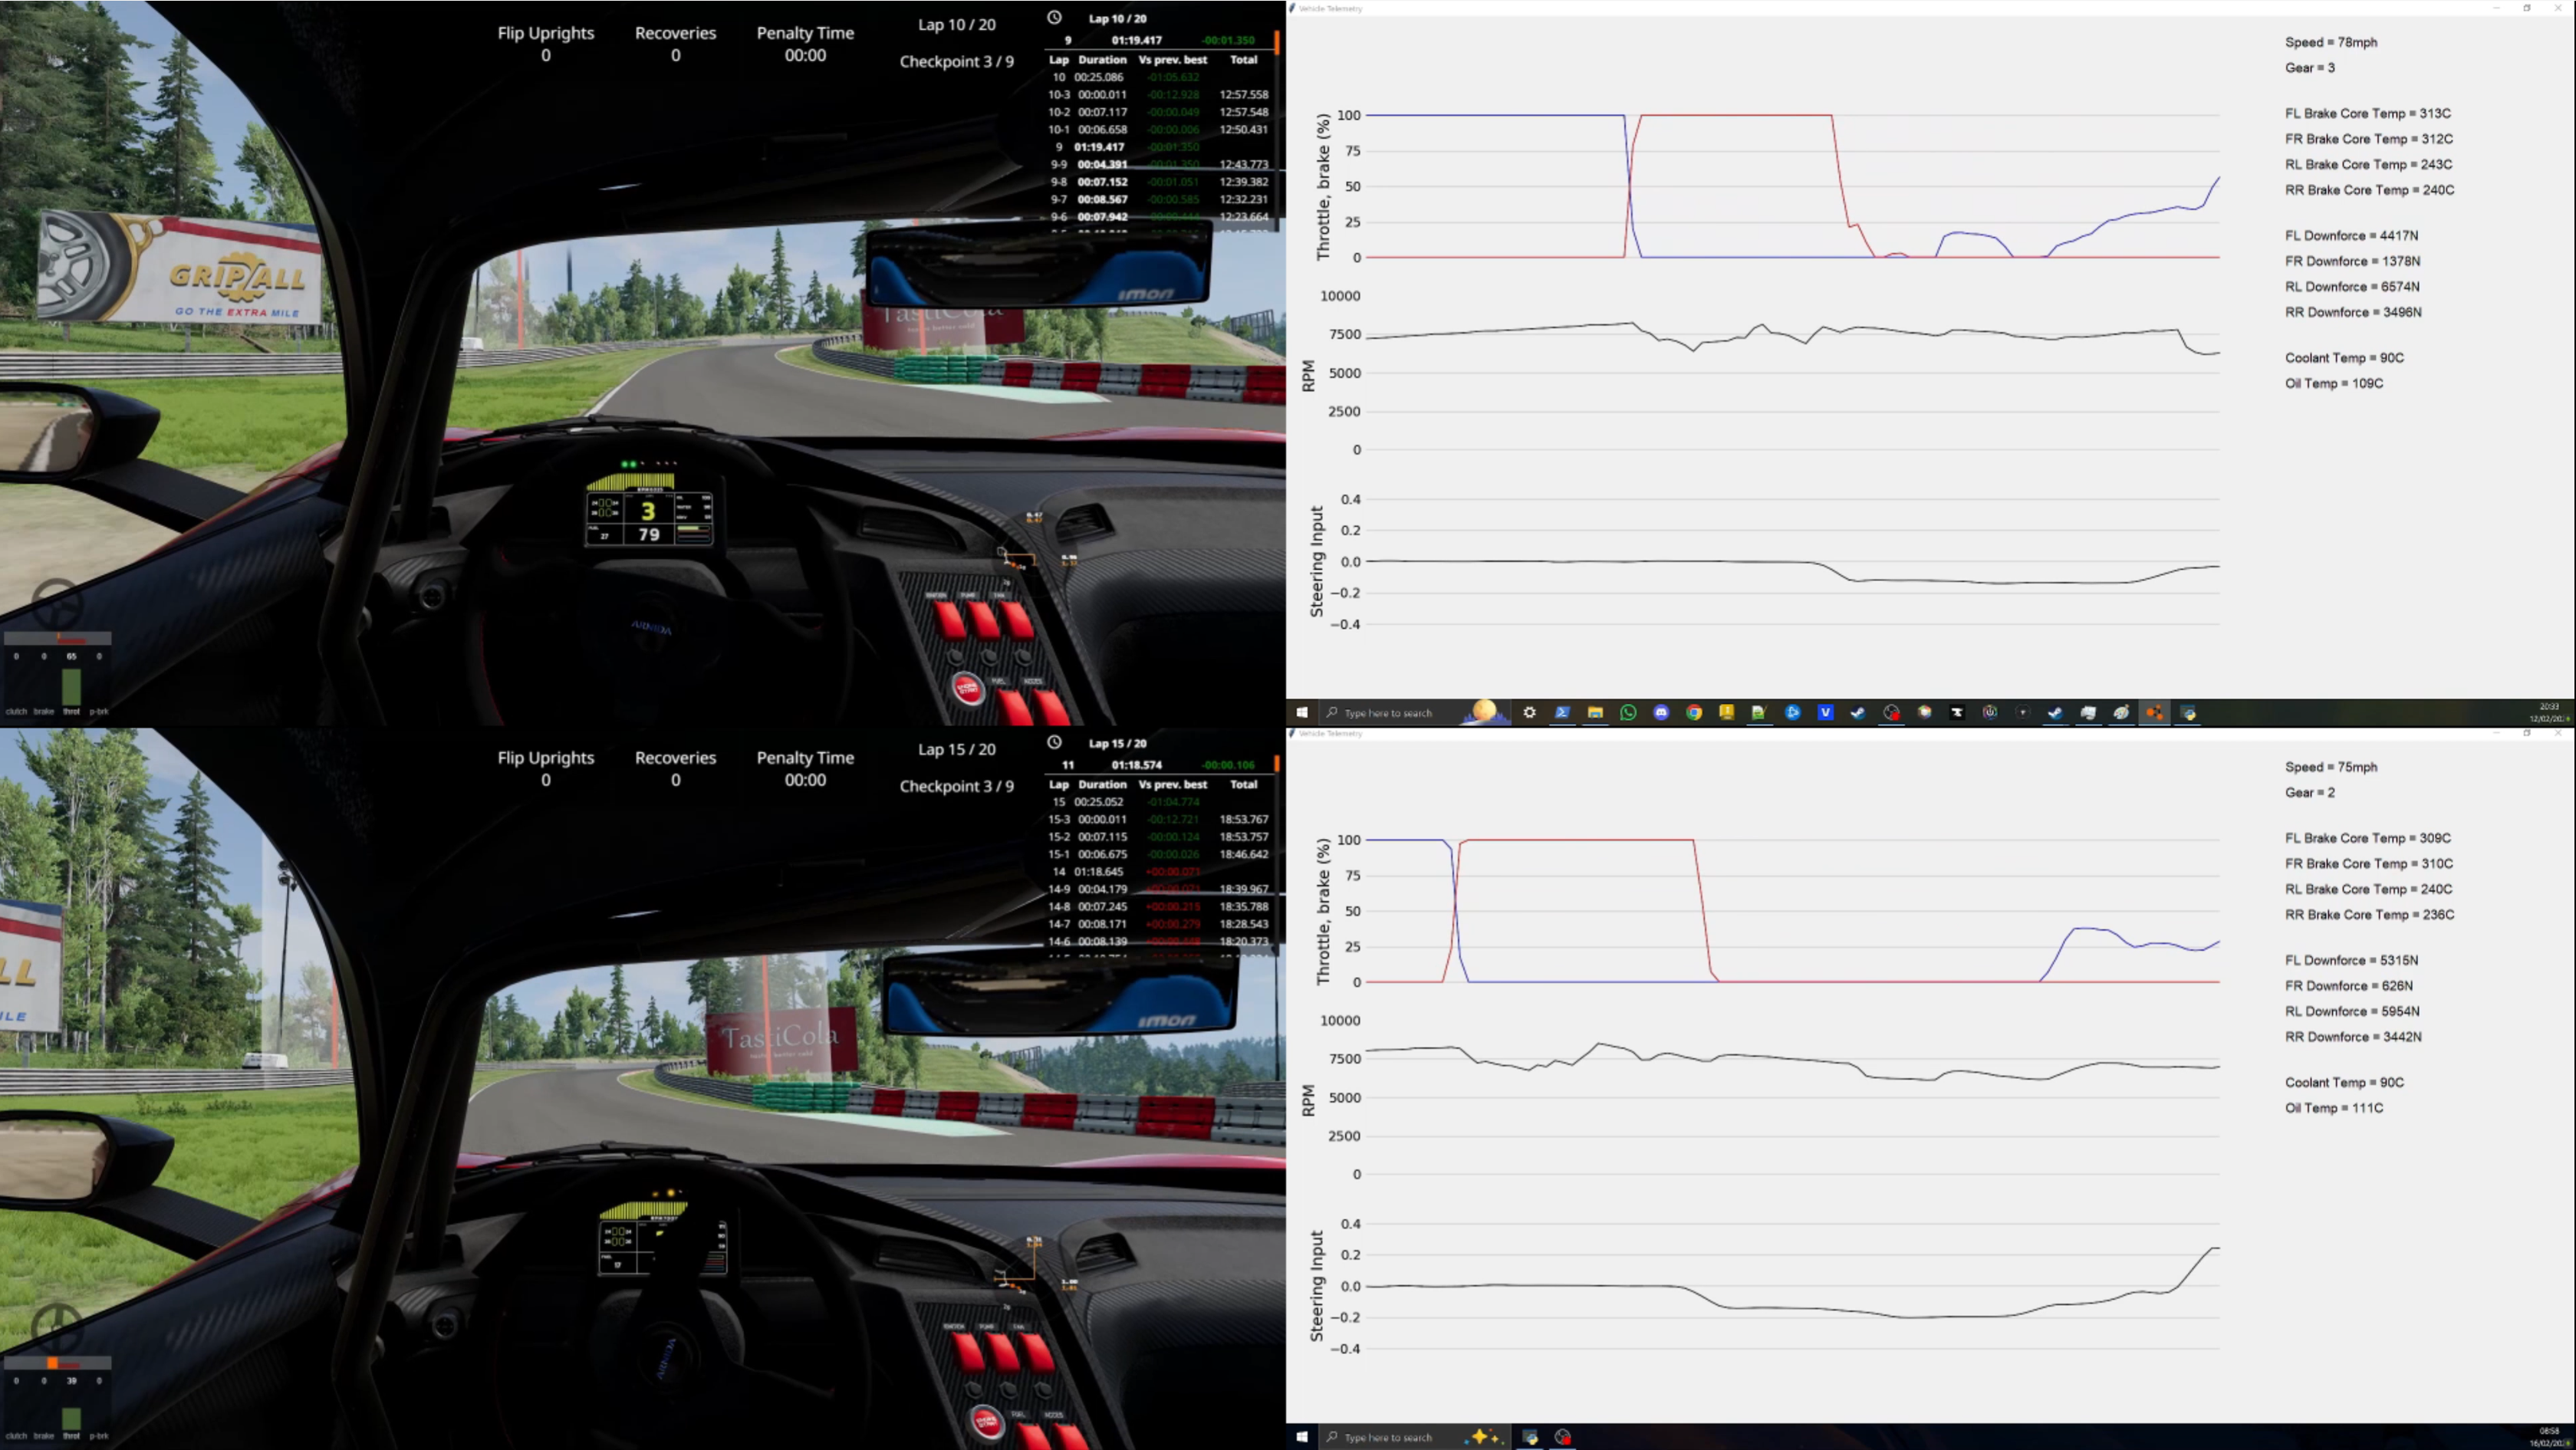
Turns 2, 3, and 4
My goal was to ‘straightline’ these turns as much as possible to minimise lateral load changes and reduce sliding. At Turn 2, setup 1 was slightly ahead, but with setup 2, I had more confidence on the throttle and didn’t lose much time.
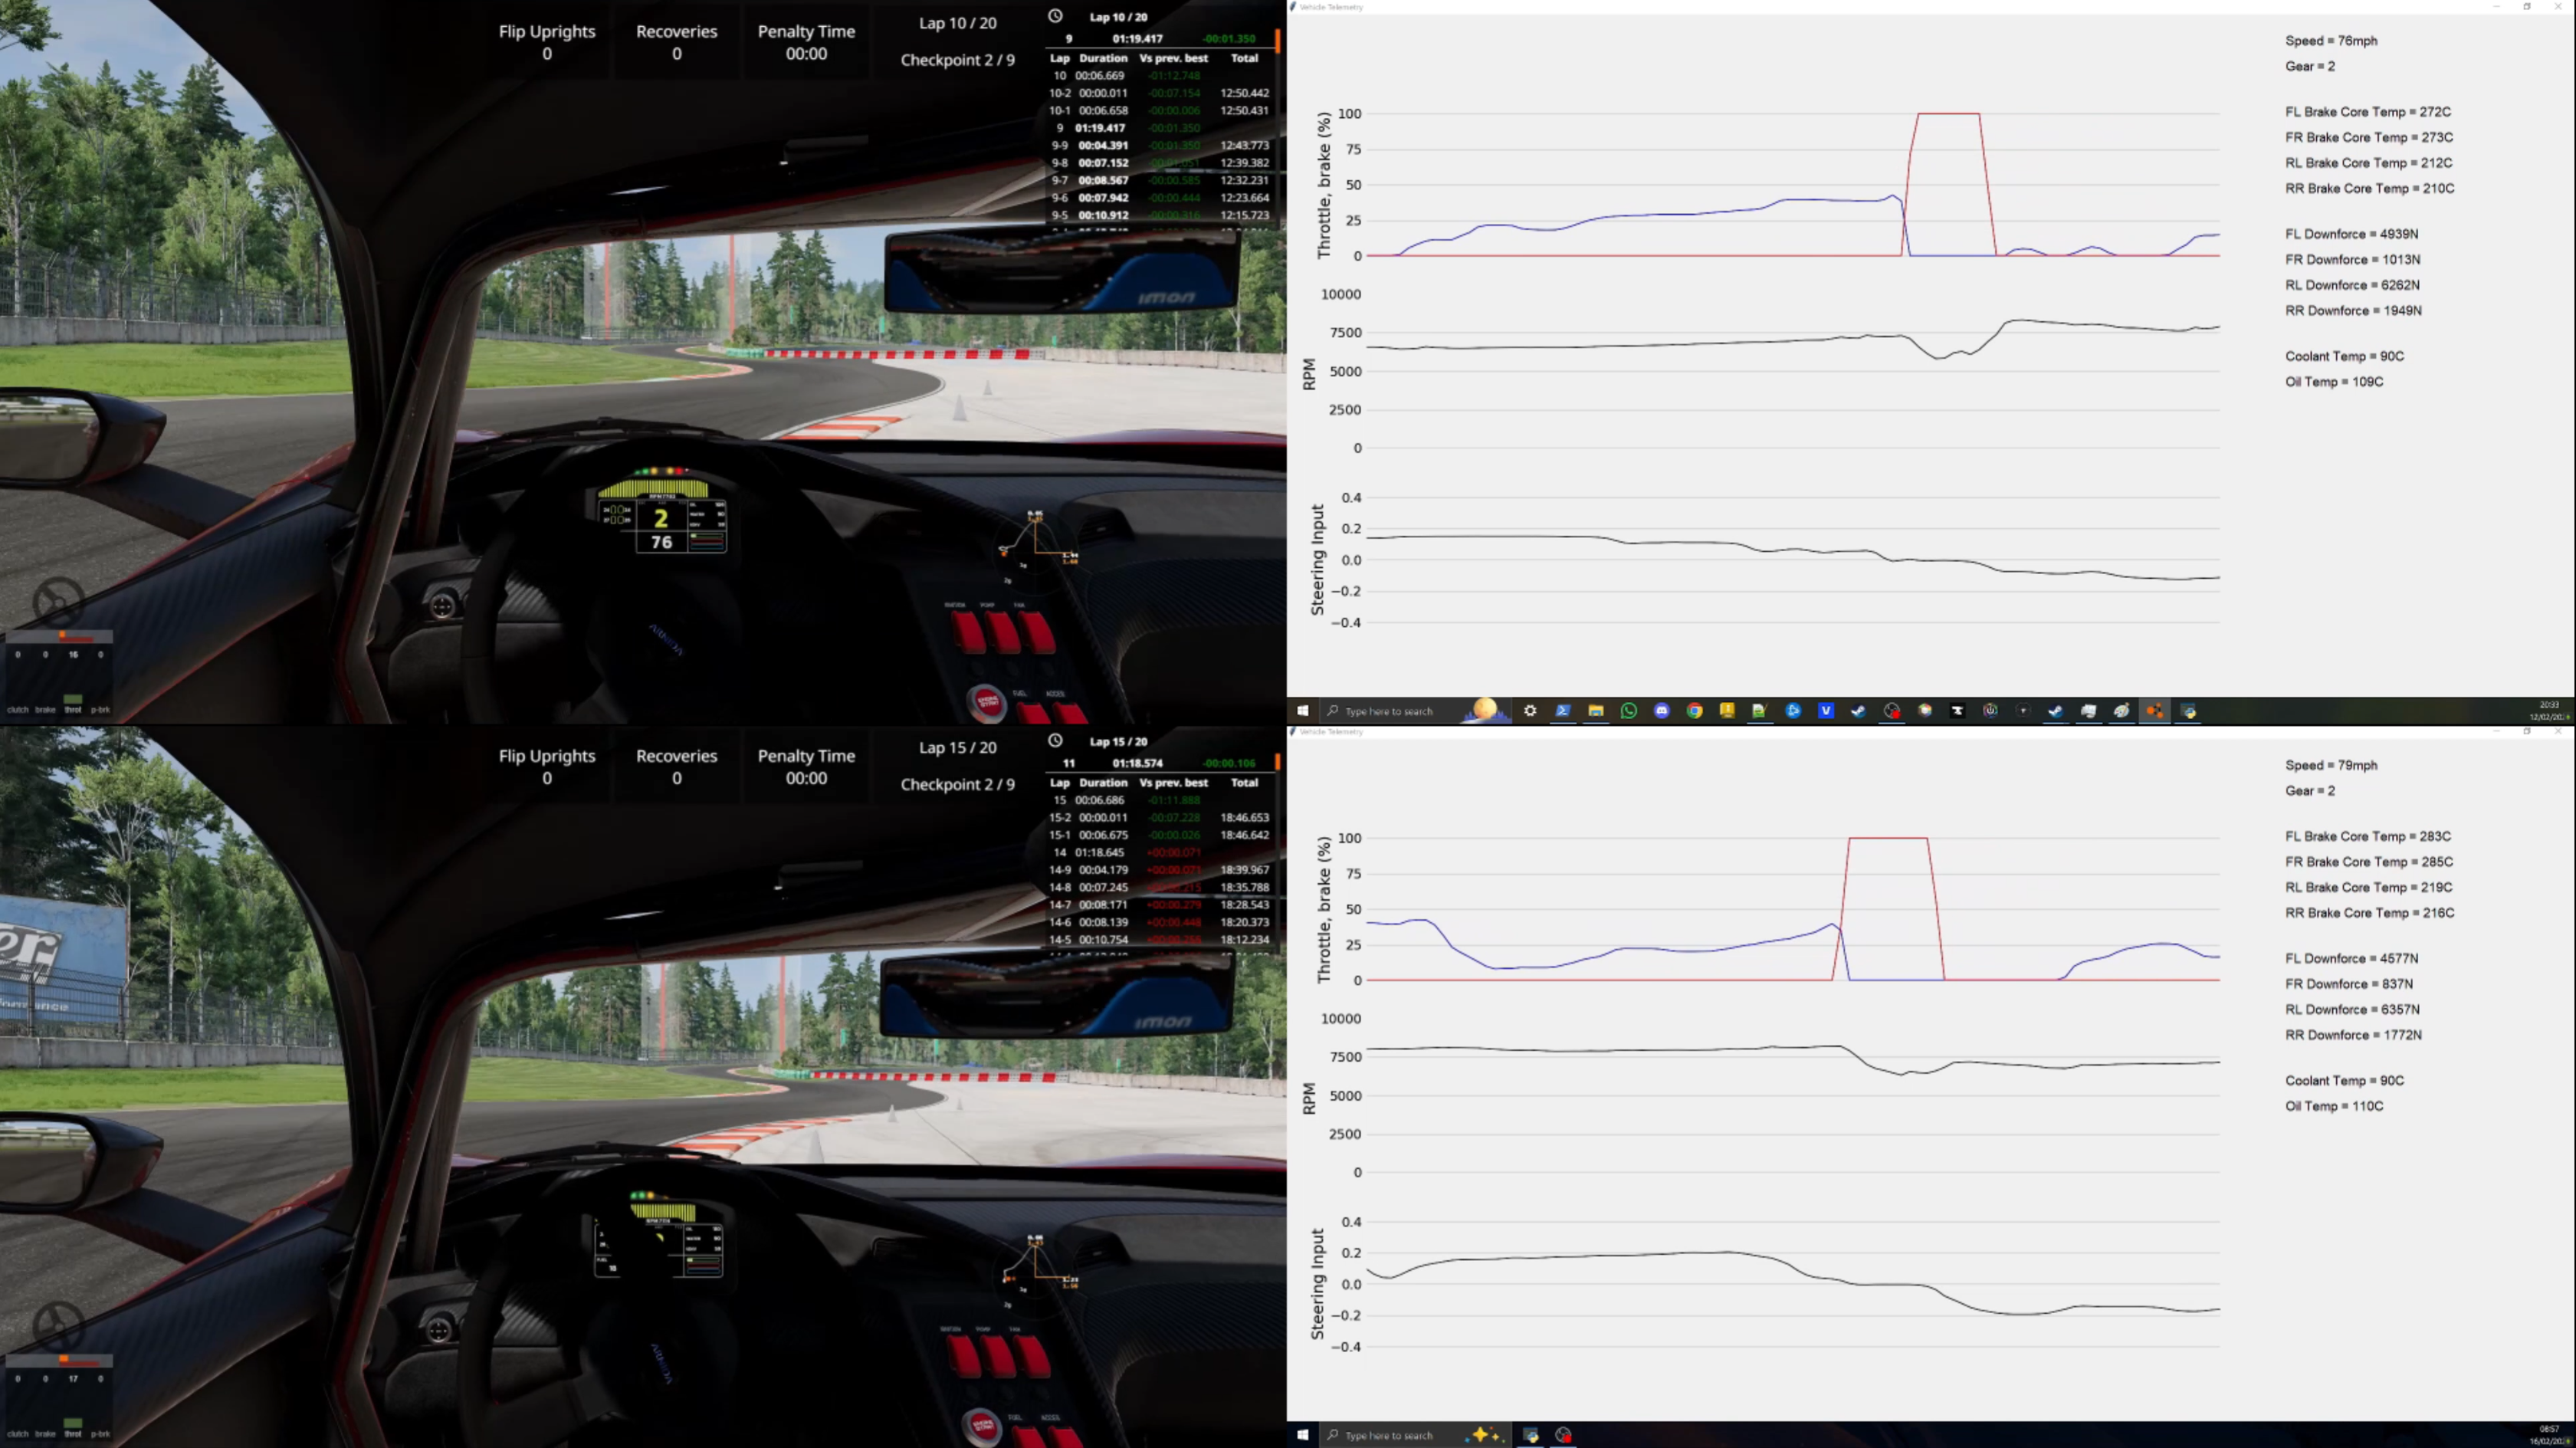
Turn 3 felt similar with both setups, though with setup 2, I was in second gear to allow extra rotation. The data shows I was able to apply more throttle between Turns 2 and 3 with setup 2.
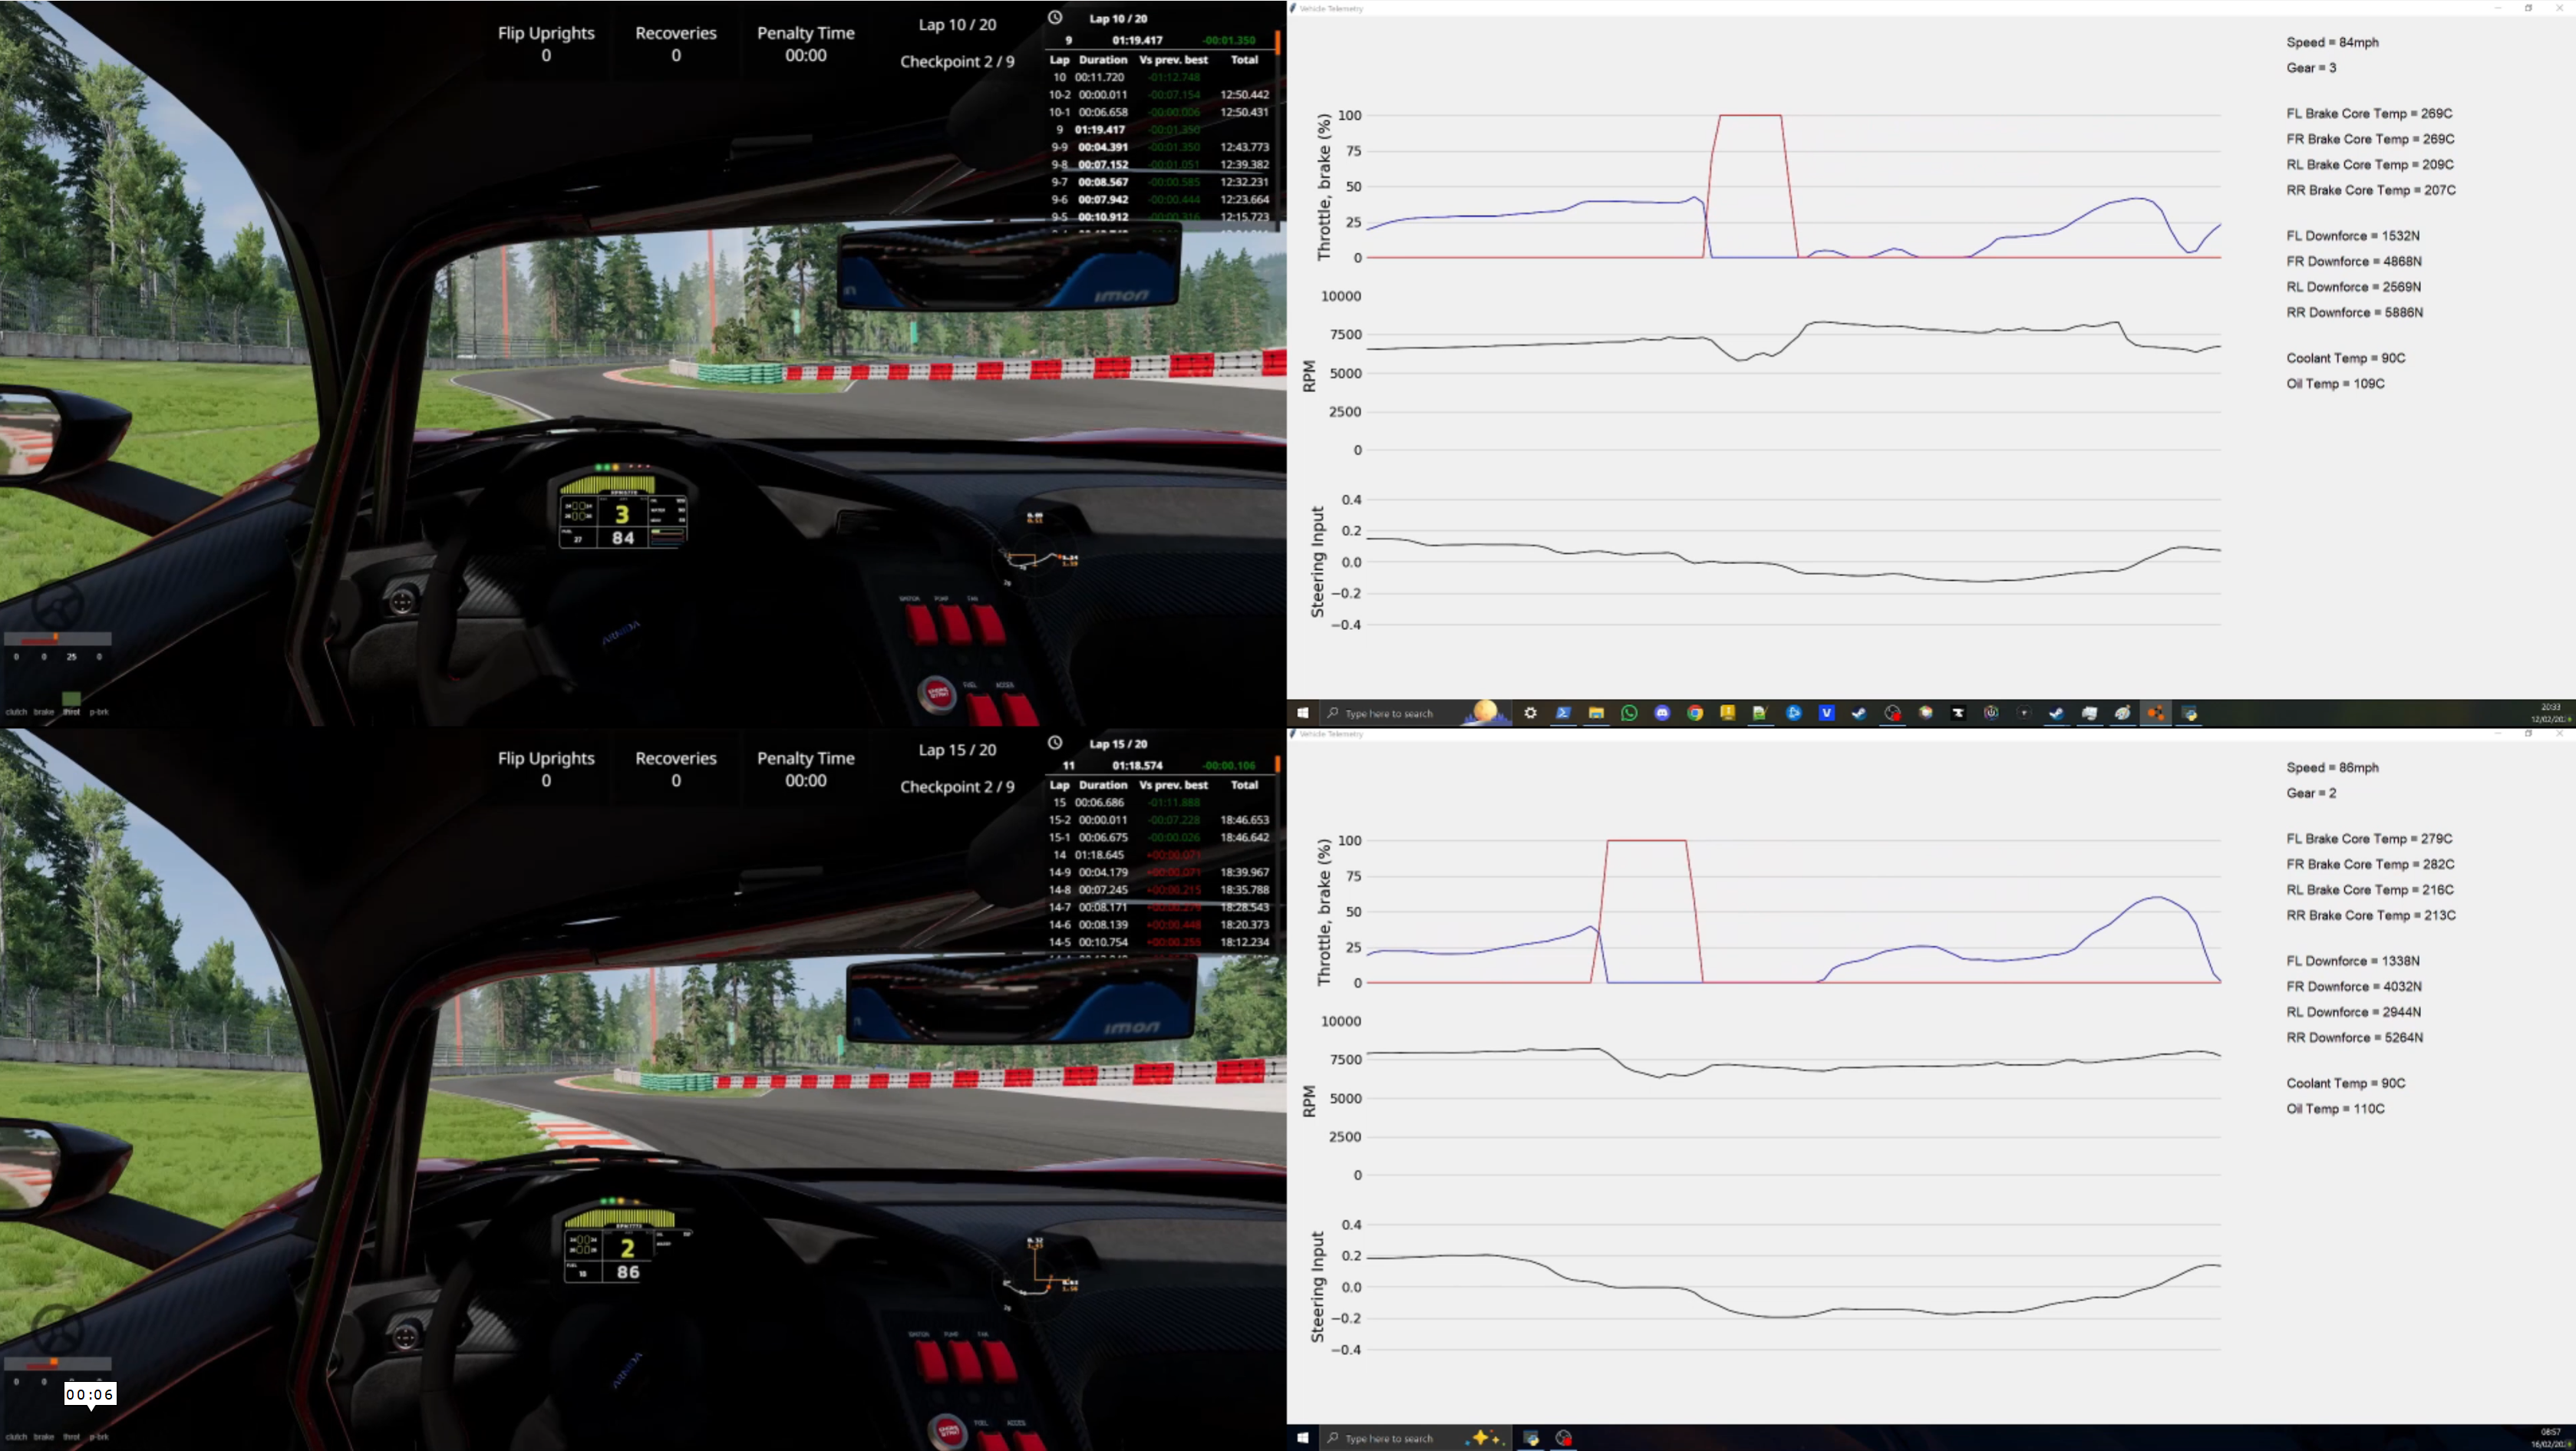
For Turn 4, I aimed to place the inside tyres over the kerb to slingshot the car around. On both setups, I had to be careful with the throttle, as the right rear tyre was on the grass.
Exiting Turn 4 was tricky since the crest reduced downforce. Too much throttle here would cause the rear tyres to lose traction. With setup 2, I was able to go full throttle with some steering input, whereas with setup 1, I had to wait until the car was mostly straight before applying full power.
Turn 2
Turn 3
Turn 4
Exit of Turn 4
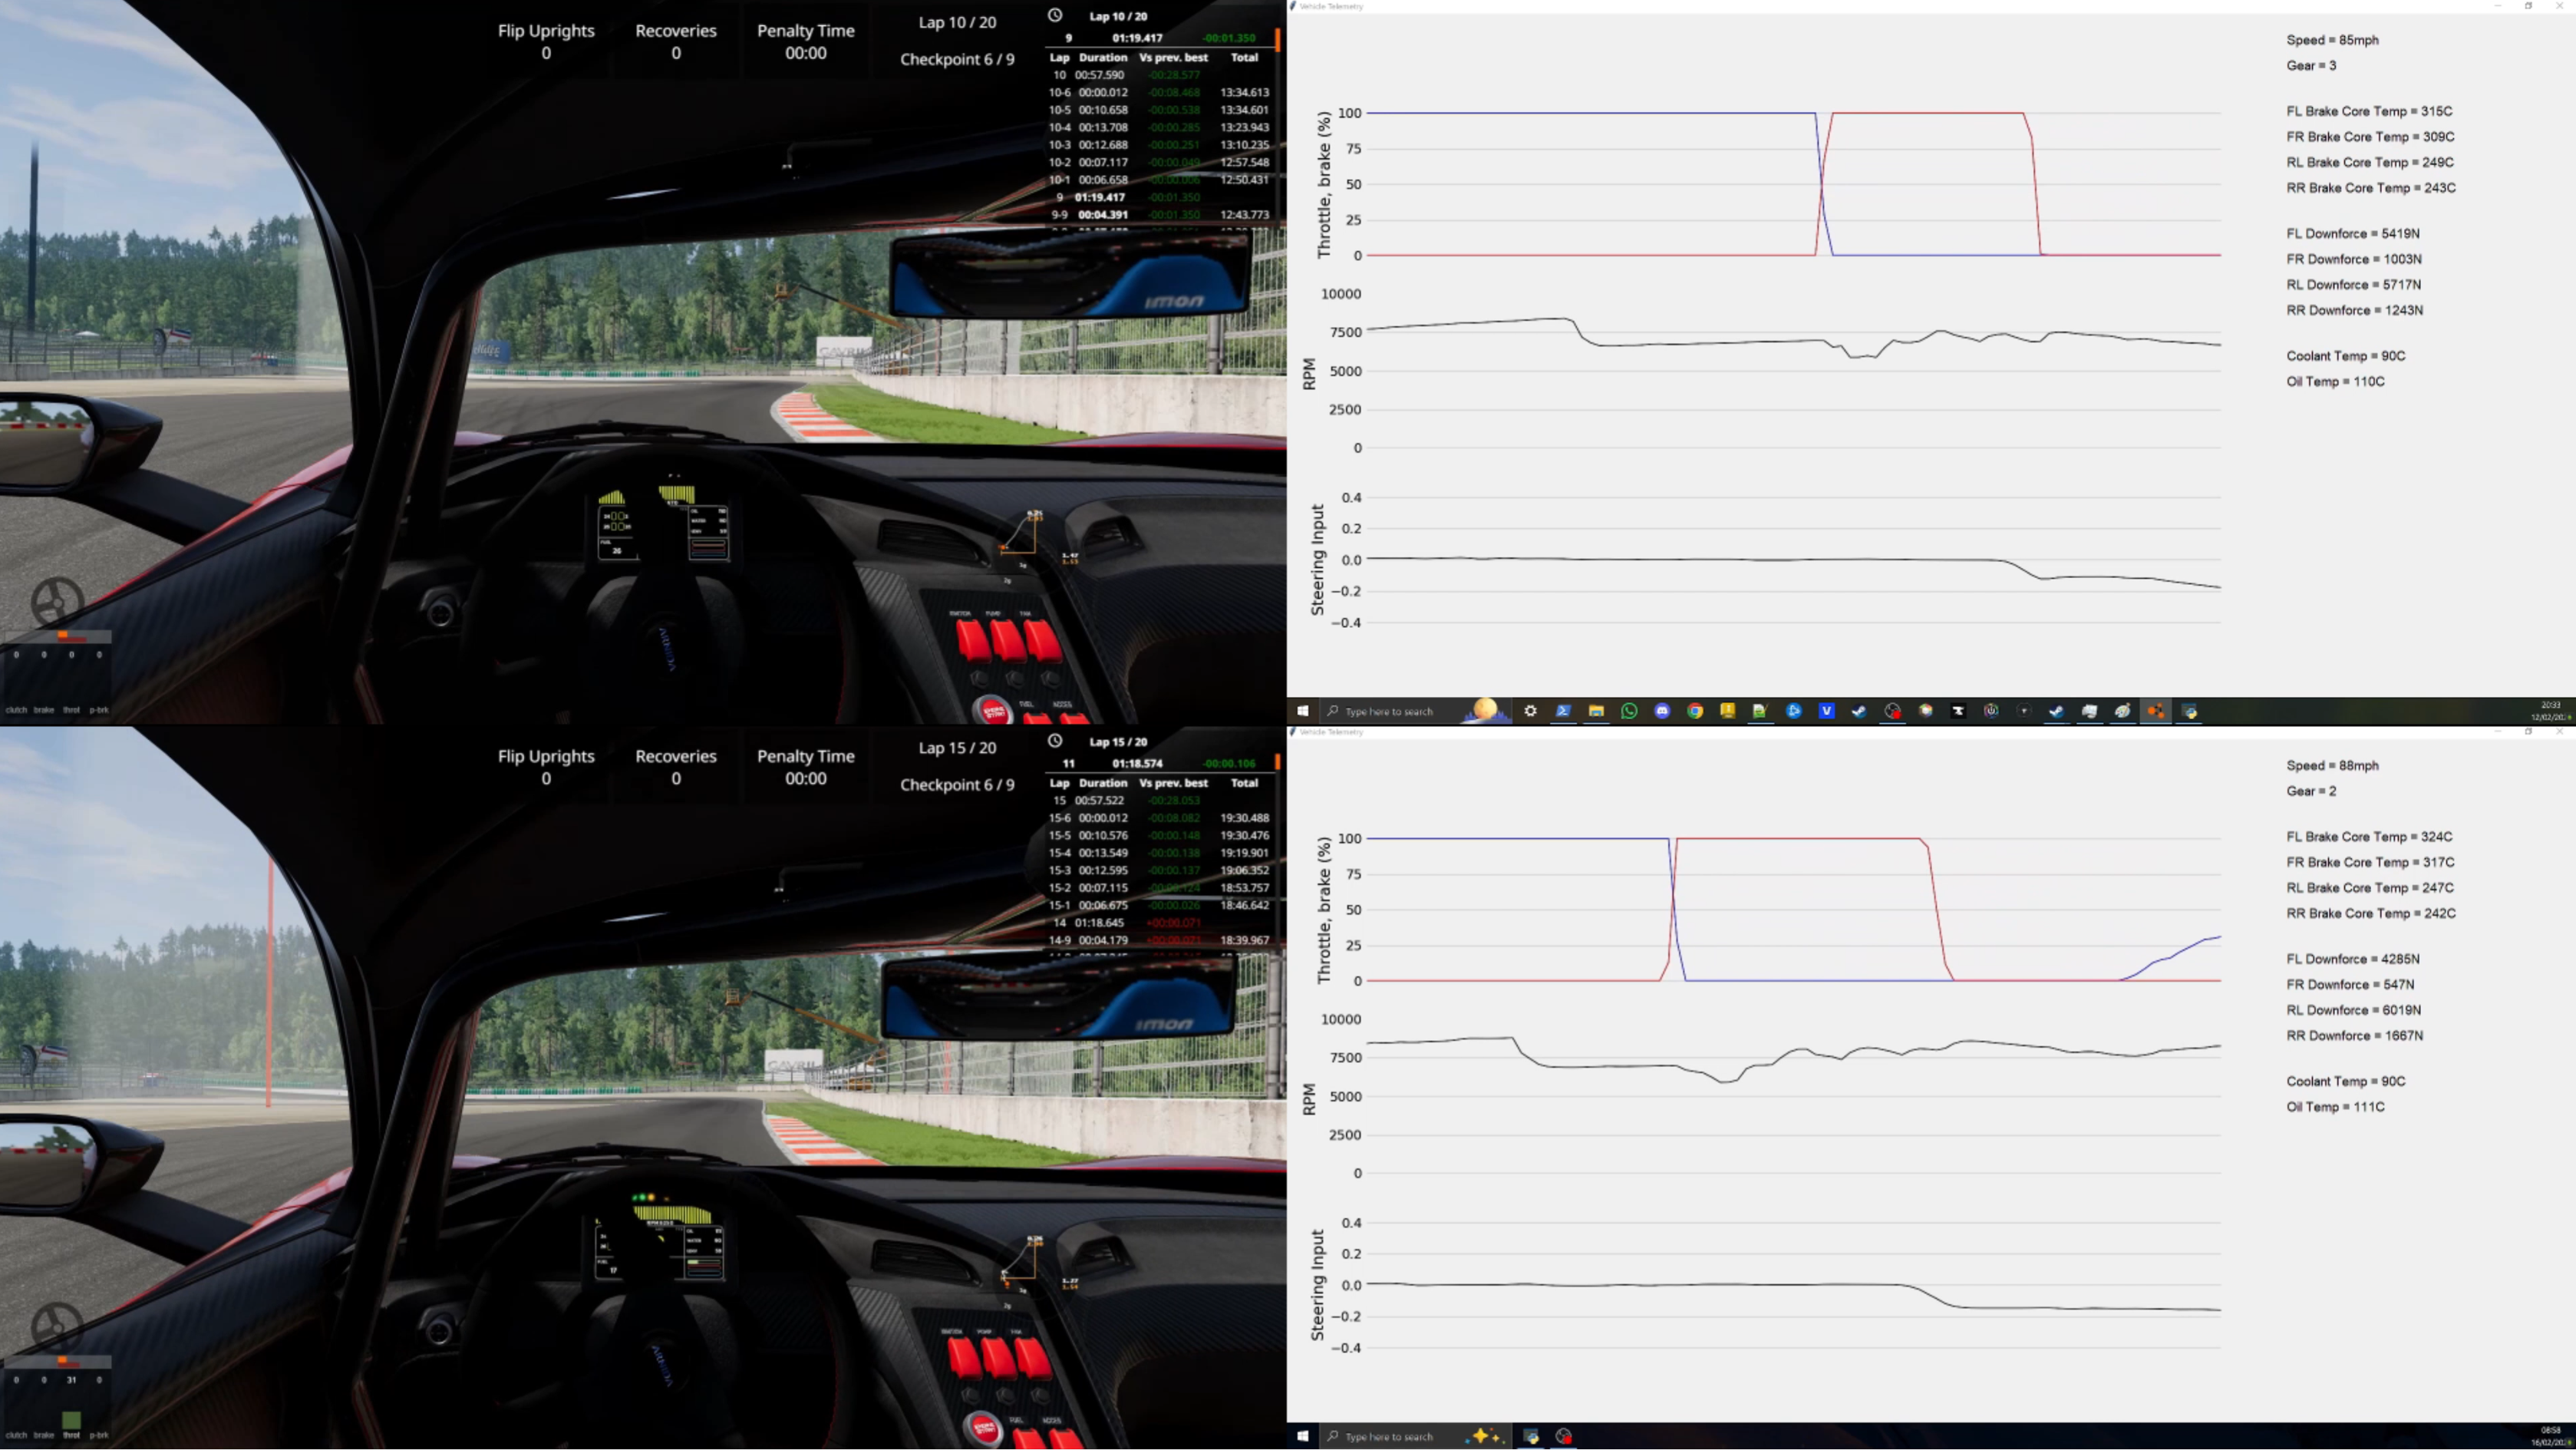
Turn 5
On both setups, I braked at the 200m board and downshifted to second gear for the apex. The two setups were similar at this point.
Exiting Turn 5 with setup 2, I was too aggressive with the throttle and steering input, causing what I’d call a bit of a wobble. The data shows a sharp steering correction to regain control. I’m confident that with setup 1, I would have completely lost control. Despite this, both setups were at roughly the same point approaching Turn 6.
Braking for Turn 5
Turn 5
Before the wobble
Mid wobble, note the change in steering input
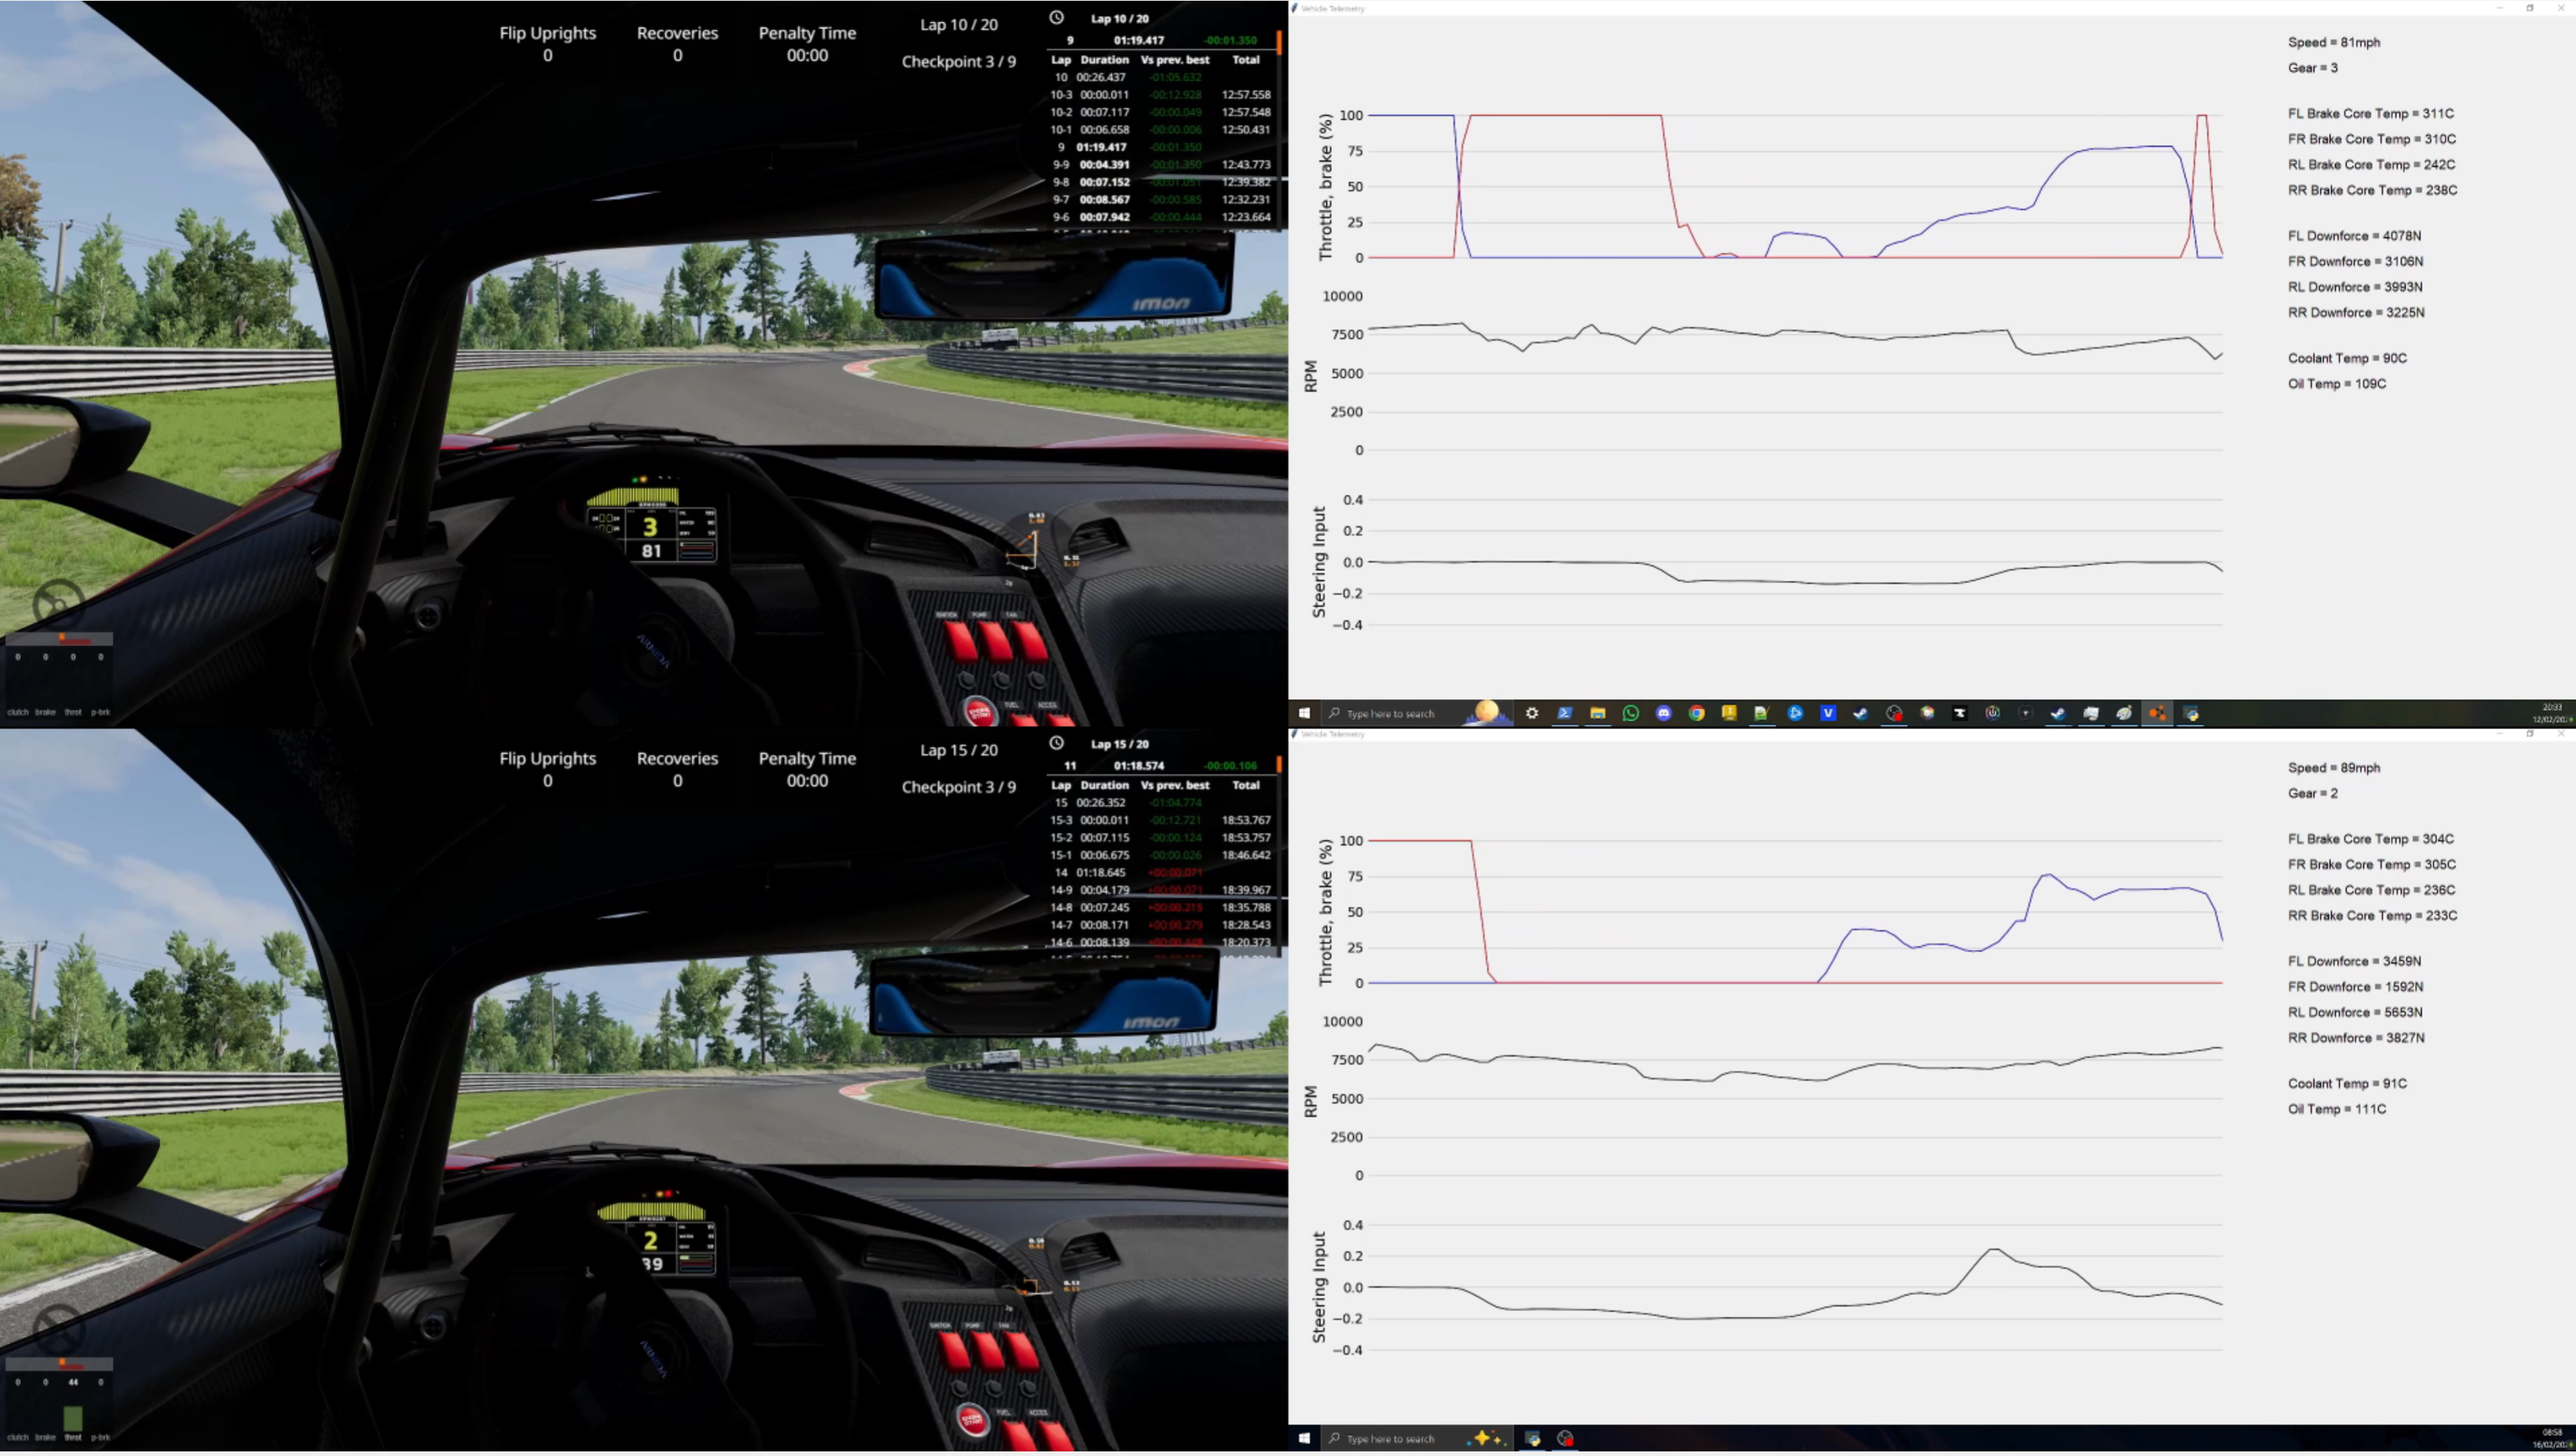
Just before Turn 6
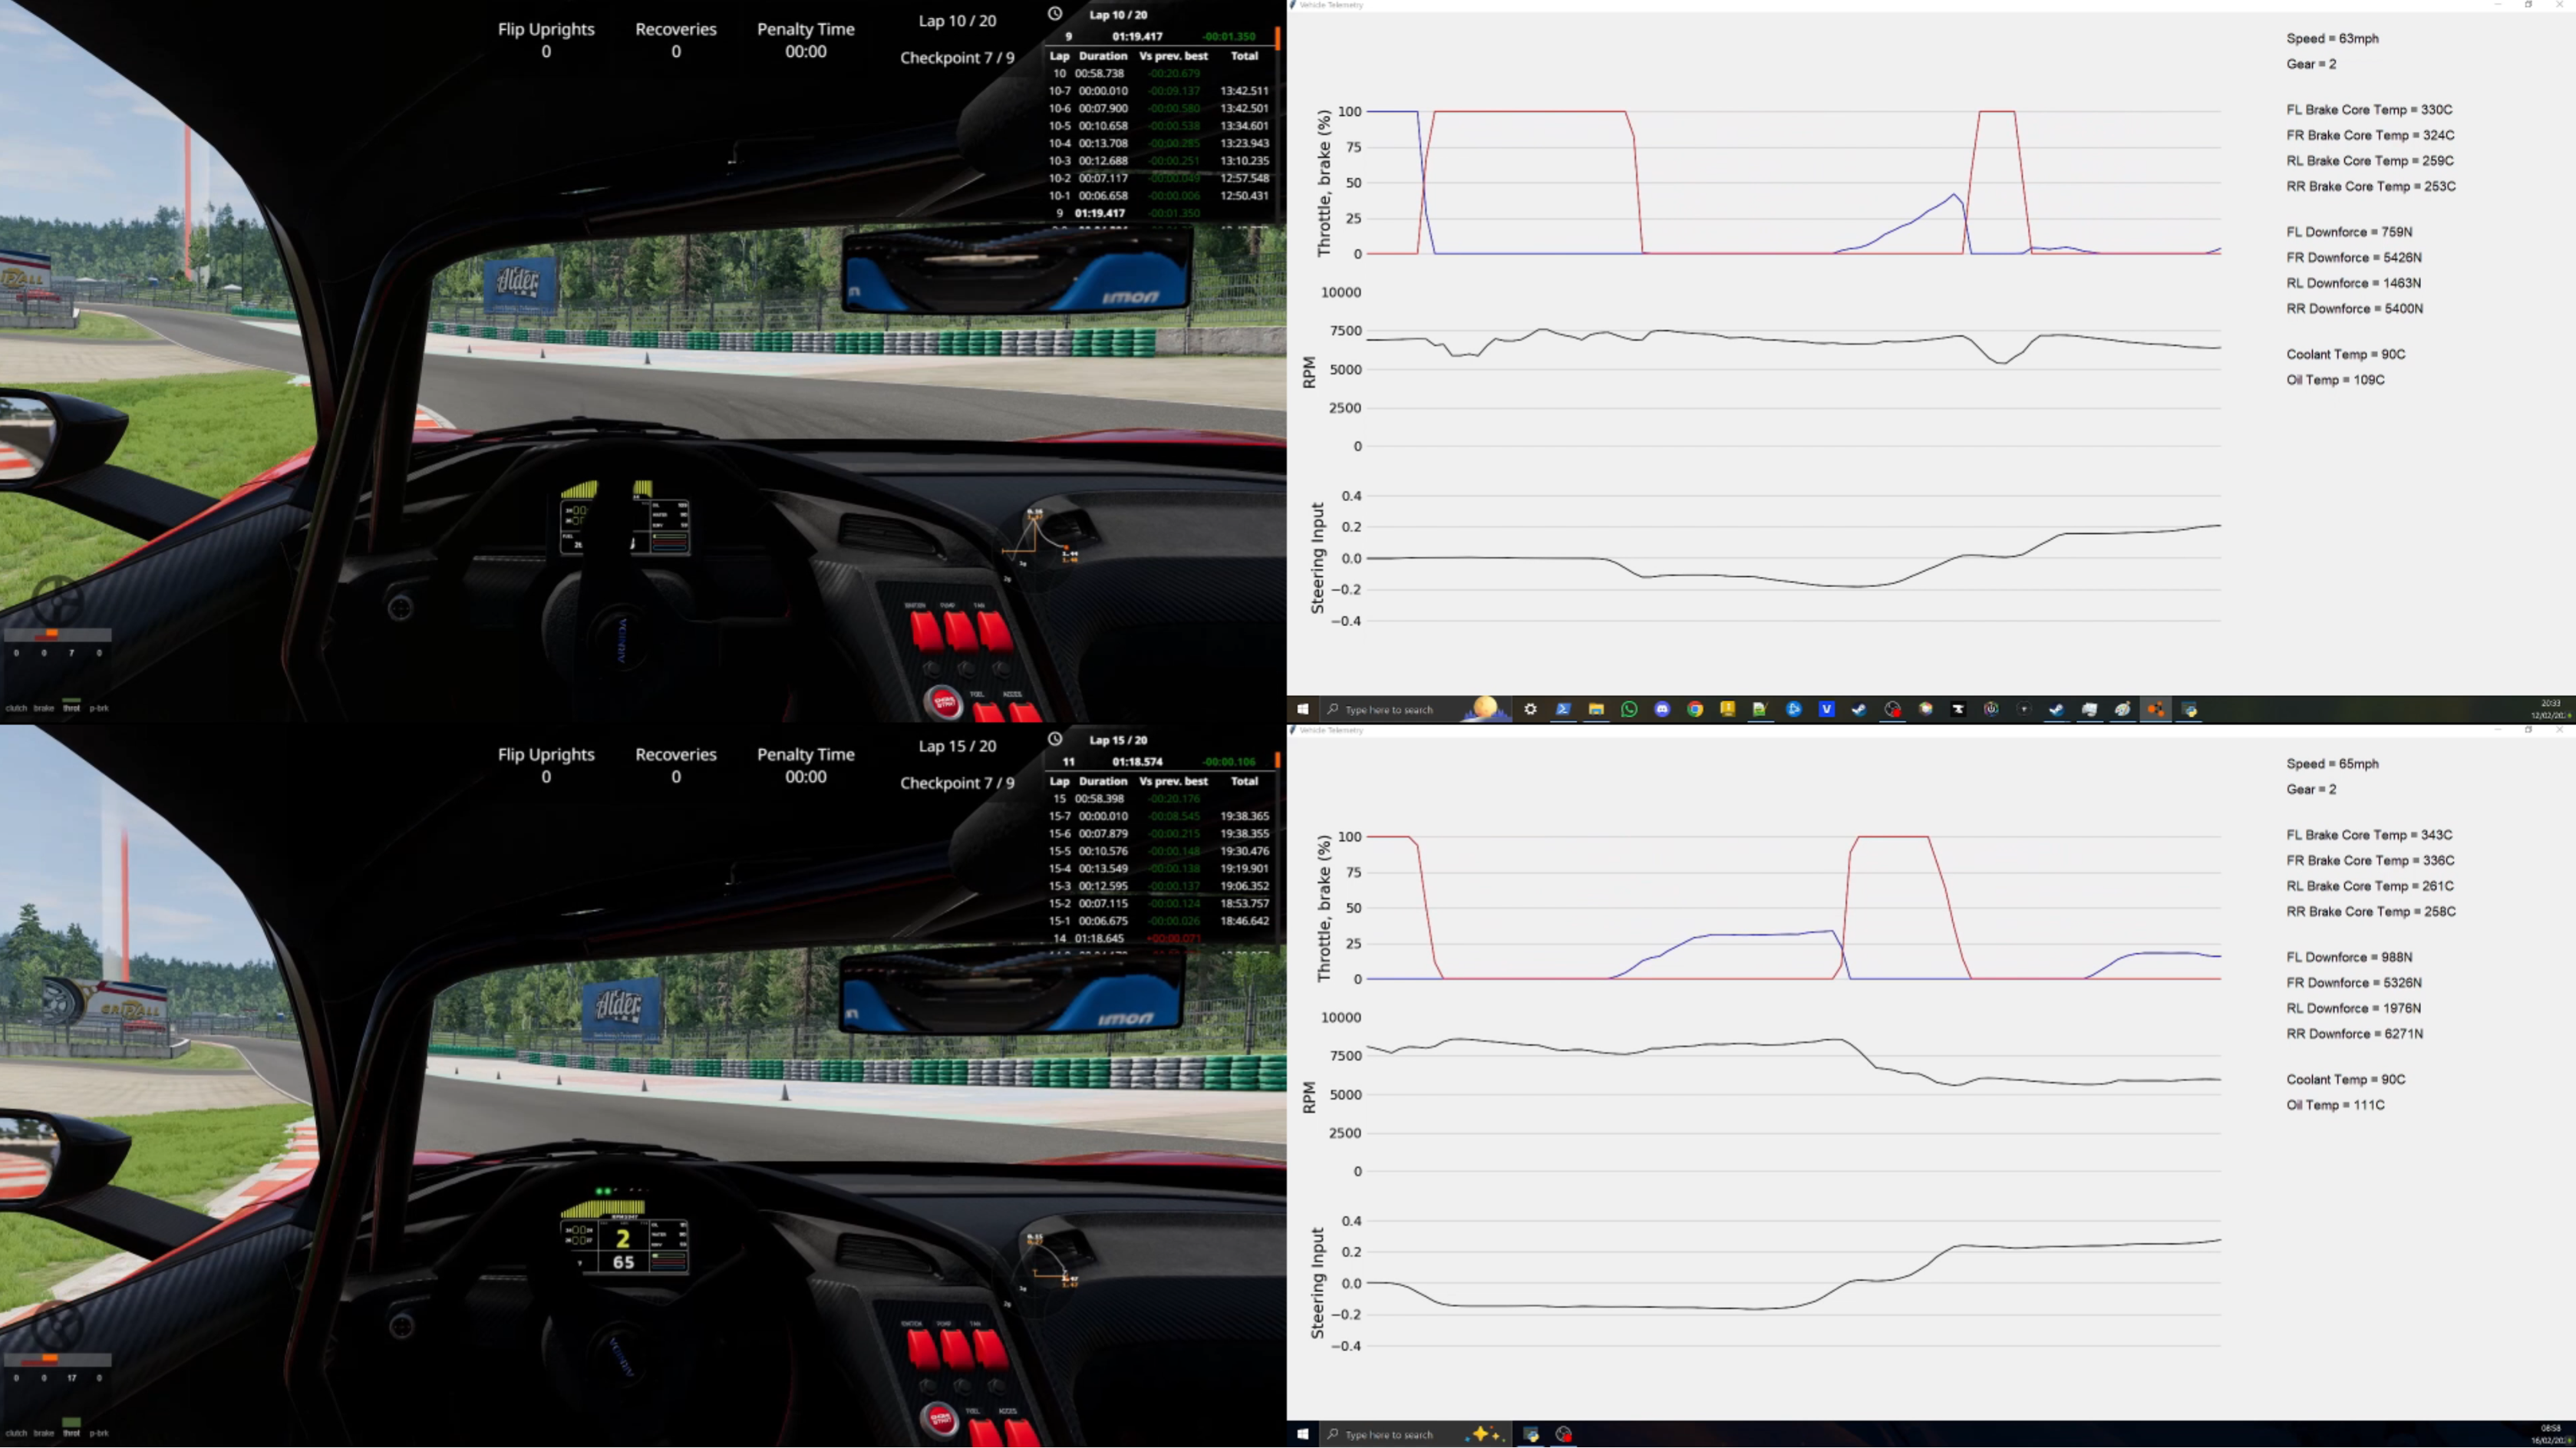
Turns 6 and 7
Turn 6 was similar between setups, though with setup 2, I could apply some throttle mid-corner. The reduced coast locking meant the car rotated more under deceleration, but a touch of throttle helped stabilize it if I felt I was sliding round rather than turning.
If the car wasn’t settled through Turn 6, Turn 7 became difficult. My approach was to go as straight as possible into the apex, shift to first gear, and coast around the corner, aiming for ~50 mph.
The throttle trace shows that with setup 2, I didn’t use the throttle at all through Turn 7. The car rotated far better than with setup 1, allowing me to set up a better line for Turn 8. The steering trace confirms I applied more steering angle with setup 2.
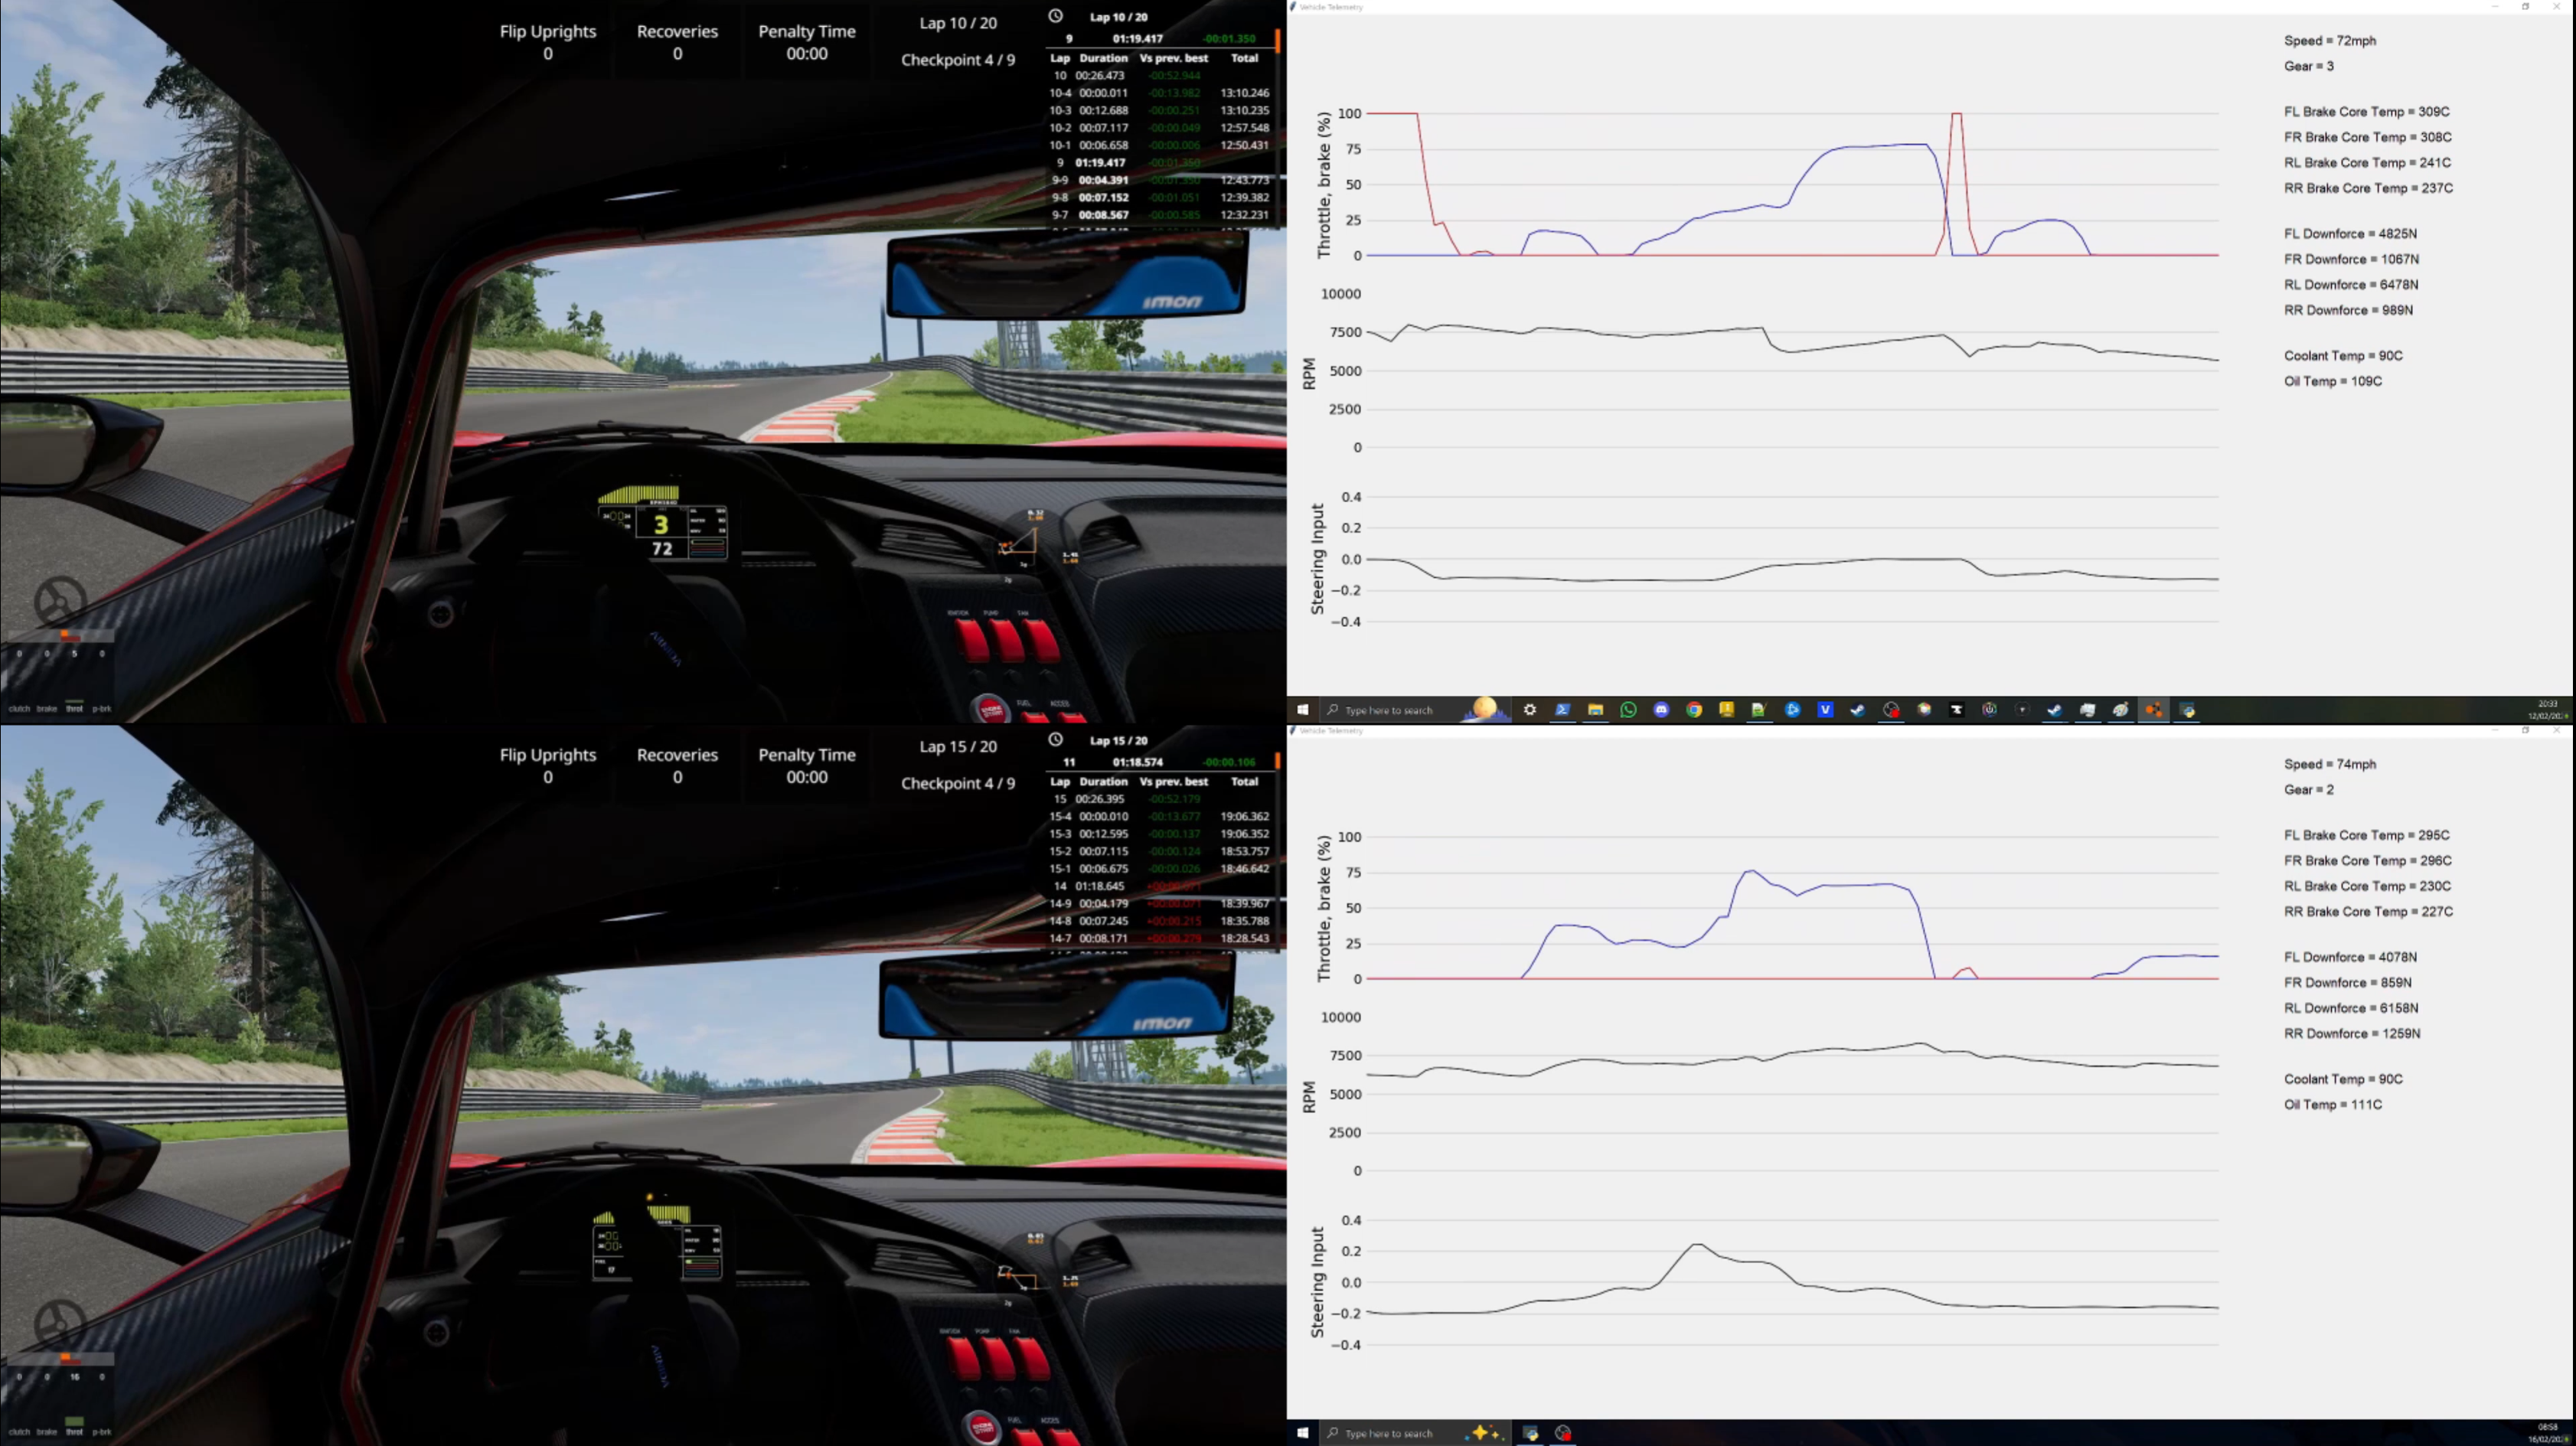
Turn 6
Just before Turn 7
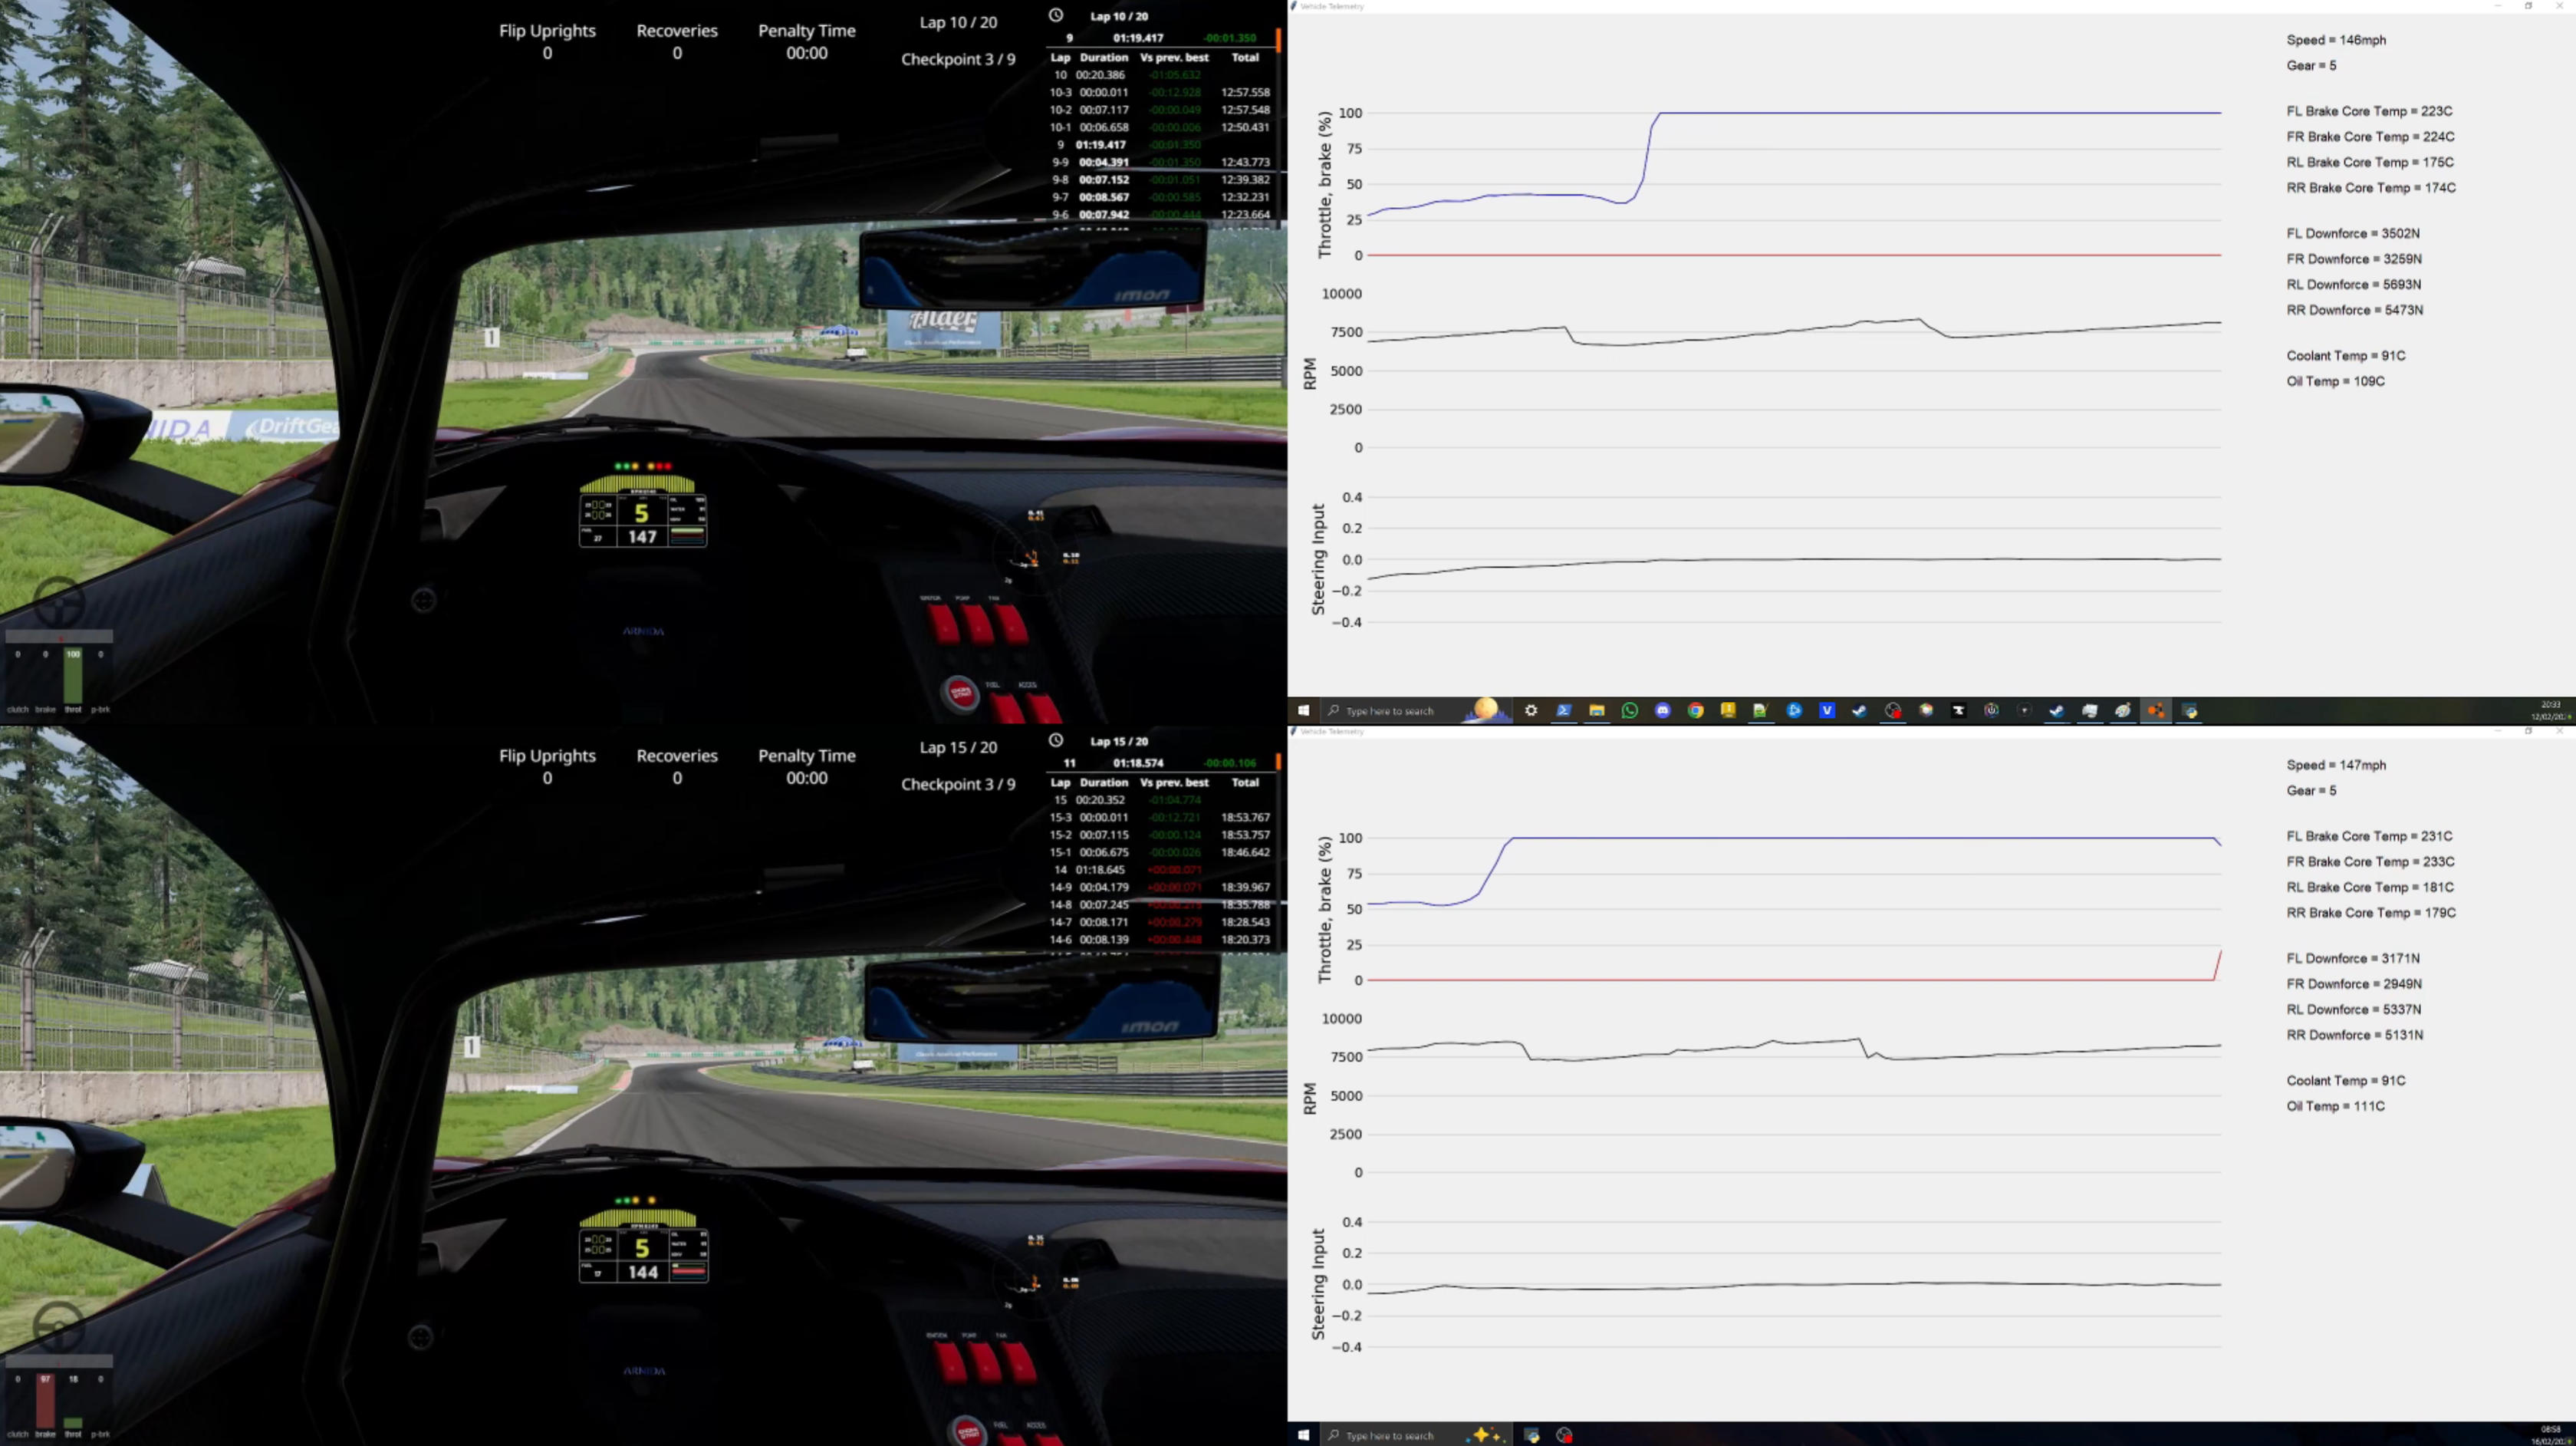
Turn 8
Like Turn 4, Turn 8’s exit was at the peak of a crest — only more pronounced. With setup 1, I had to be extremely cautious with steering and throttle to avoid losing control. With setup 2, I was far more confident and used full throttle over the crest, consistently rotating the car and setting up a straight exit. Most laps with setup 2 were taken at full throttle over the crest.
Turn 8
Crest of Turn 8, note the sharp application of throttle in setup 2
Turn 9
Turn 9 was tricky, as I wasn’t sure of the best line. I experimented with both a wide entry (to maximise exit speed) and a tighter line along the kerb. Setup 2 allowed me to use more throttle throughout the turn. With setup 1, the car often felt unsettled on exit, leading to multiple crashes. Setup 2 provided a much smoother exit.
Exit of Turn 9
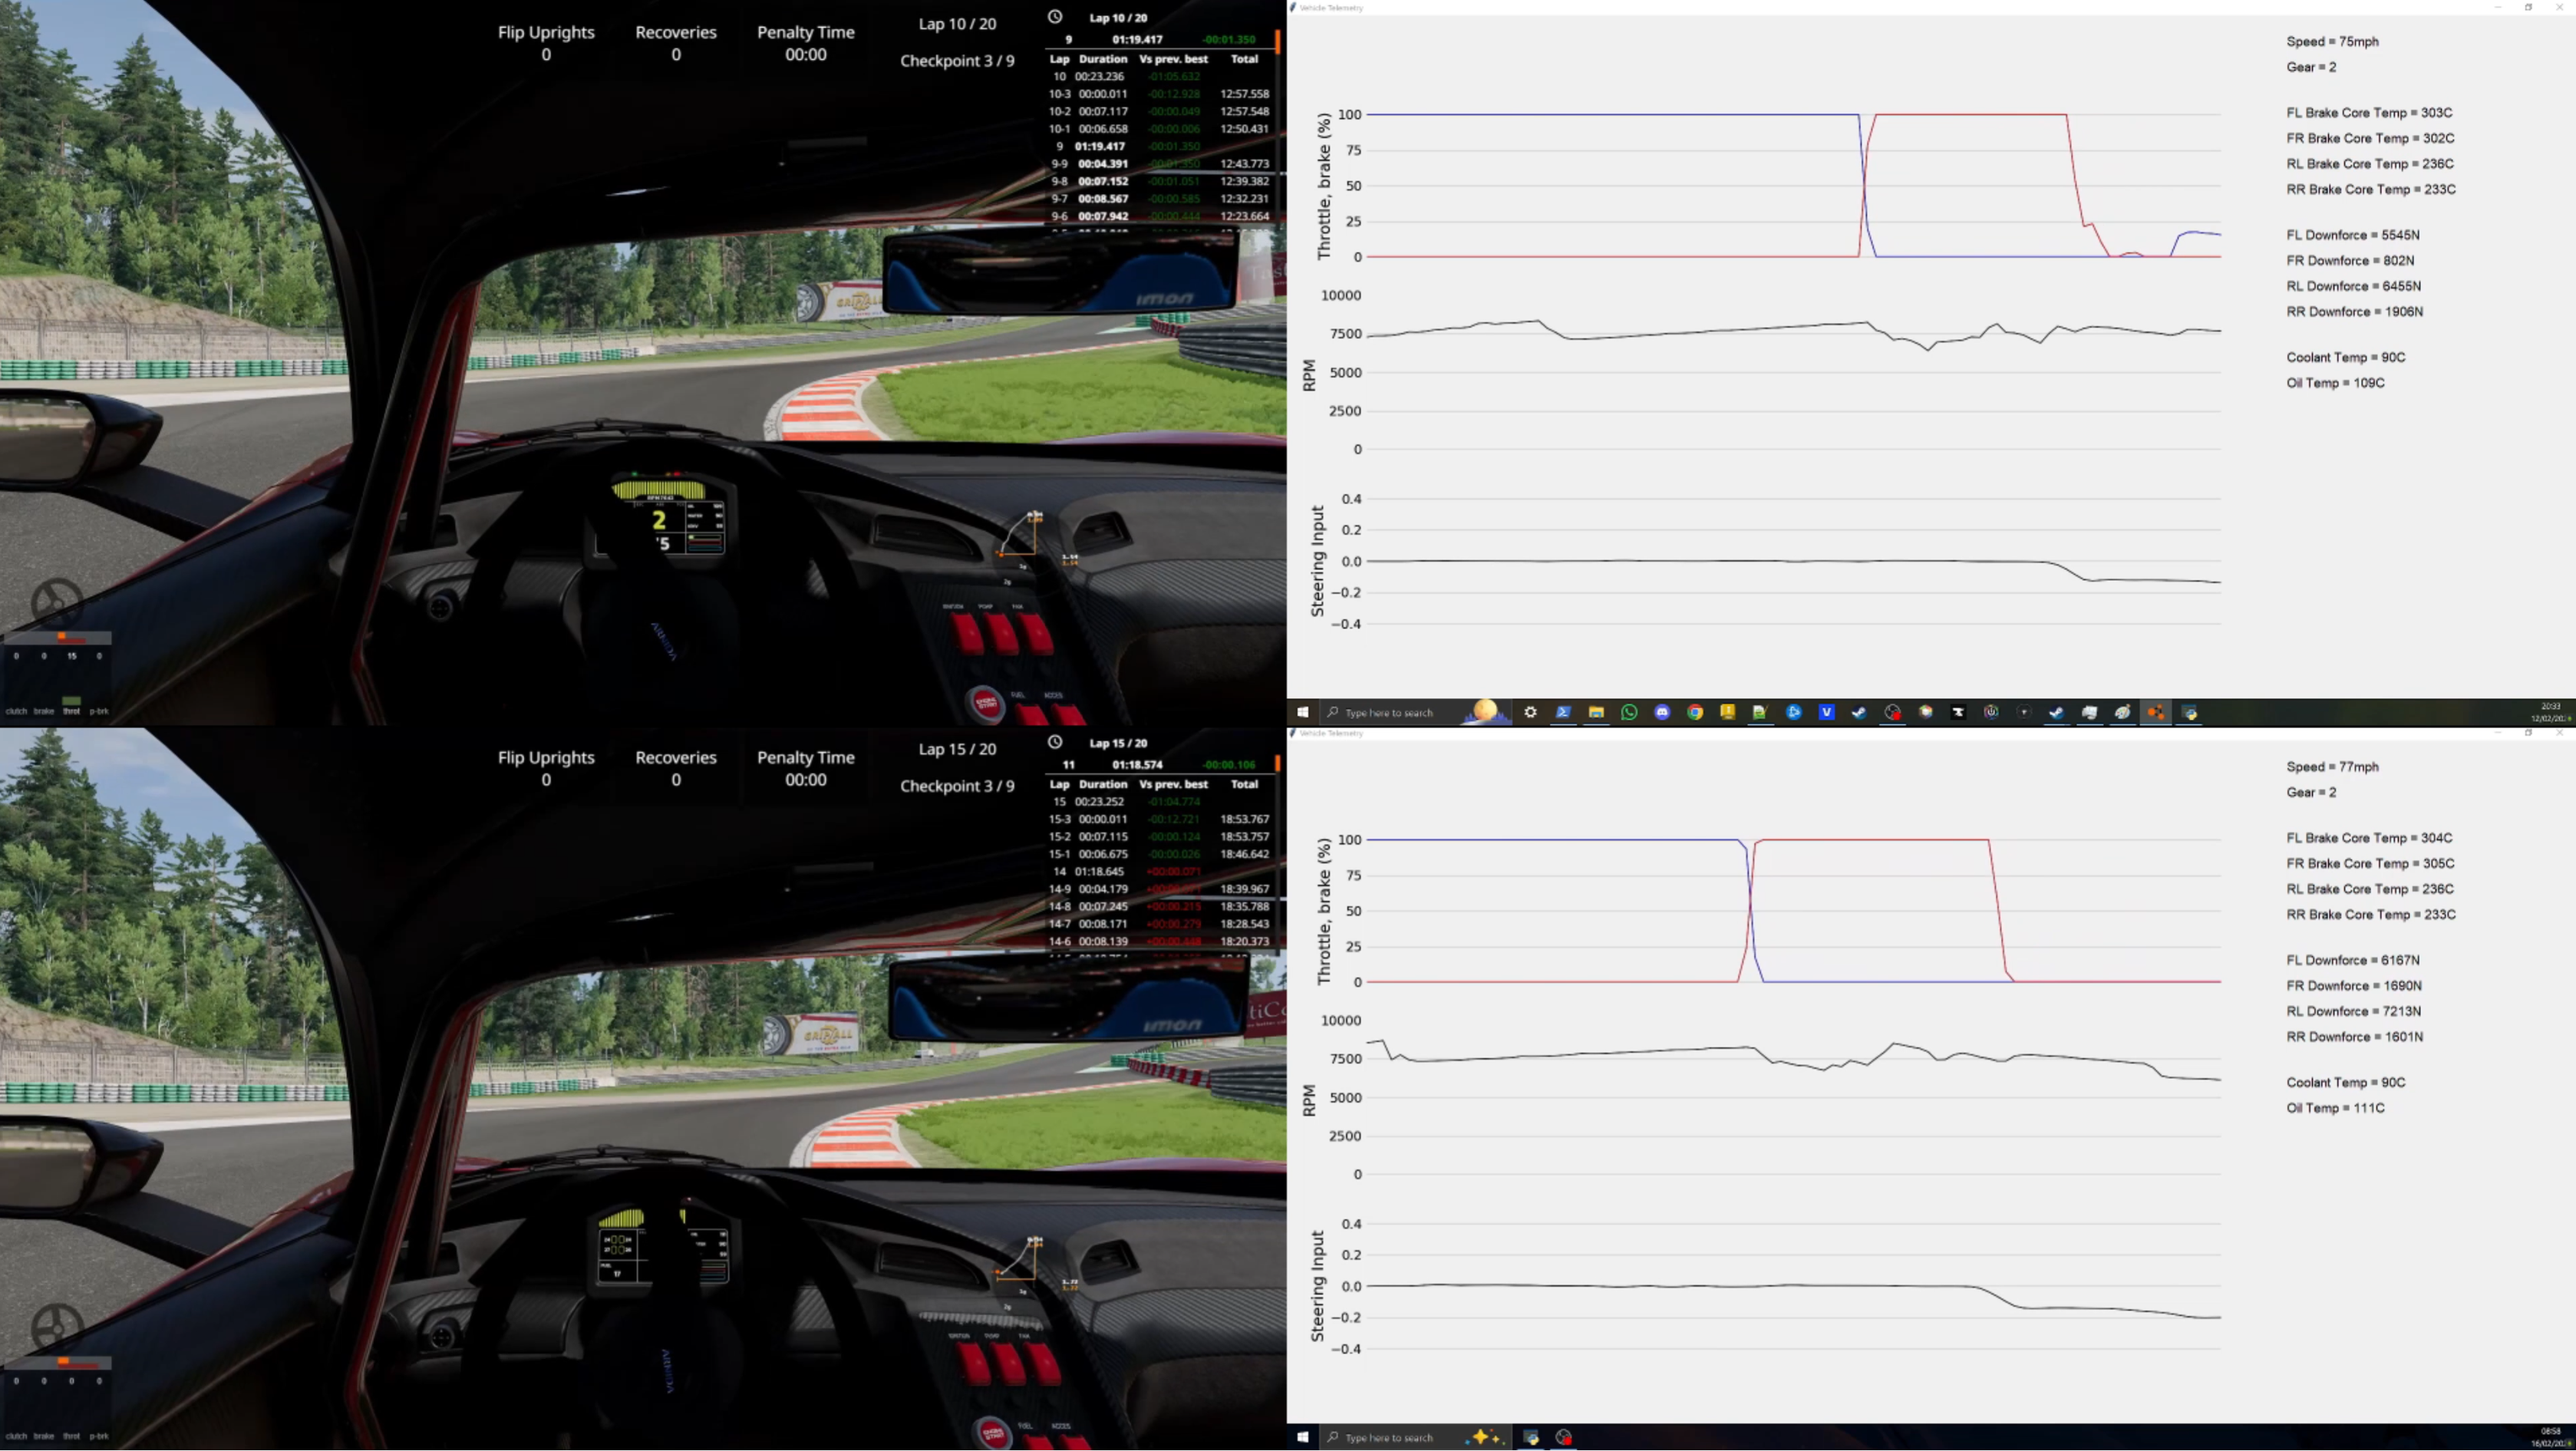
Turns 10 and 11
This chicane required heavy braking into Turn 10, followed by a strong turn-in as soon as braking finished.
At the Turn 11 apex, I had a higher speed with setup 1, but with setup 2, I could get on the throttle earlier. Thanks to a shorter third gear, the overall time difference between setups was minimal. Similar to Turn 4, I aimed to place the inside tyres over the kerbs for better rotation.
Exit of Turn 11
Turns 12 and 13
Approaching Turn 12 involved the heaviest braking zone on the track. I aimed to get down to second gear, stay tight to the kerb, and set up a straight exit for Turn 13. With setup 2, I could apply some throttle through the corner for a quicker exit while maintaining a more consistent steering angle.
For Turn 13, I stayed in second gear throughout. Setup 2 allowed for both more steering angle and throttle, whereas setup 1 didn’t. Shortly after, on the straight section, I could use full throttle while still turning with setup 2. The throttle trace for setup 1 shows a gradual increase, whereas setup 2 shows a sharp application.
Turn 12
Turn 13
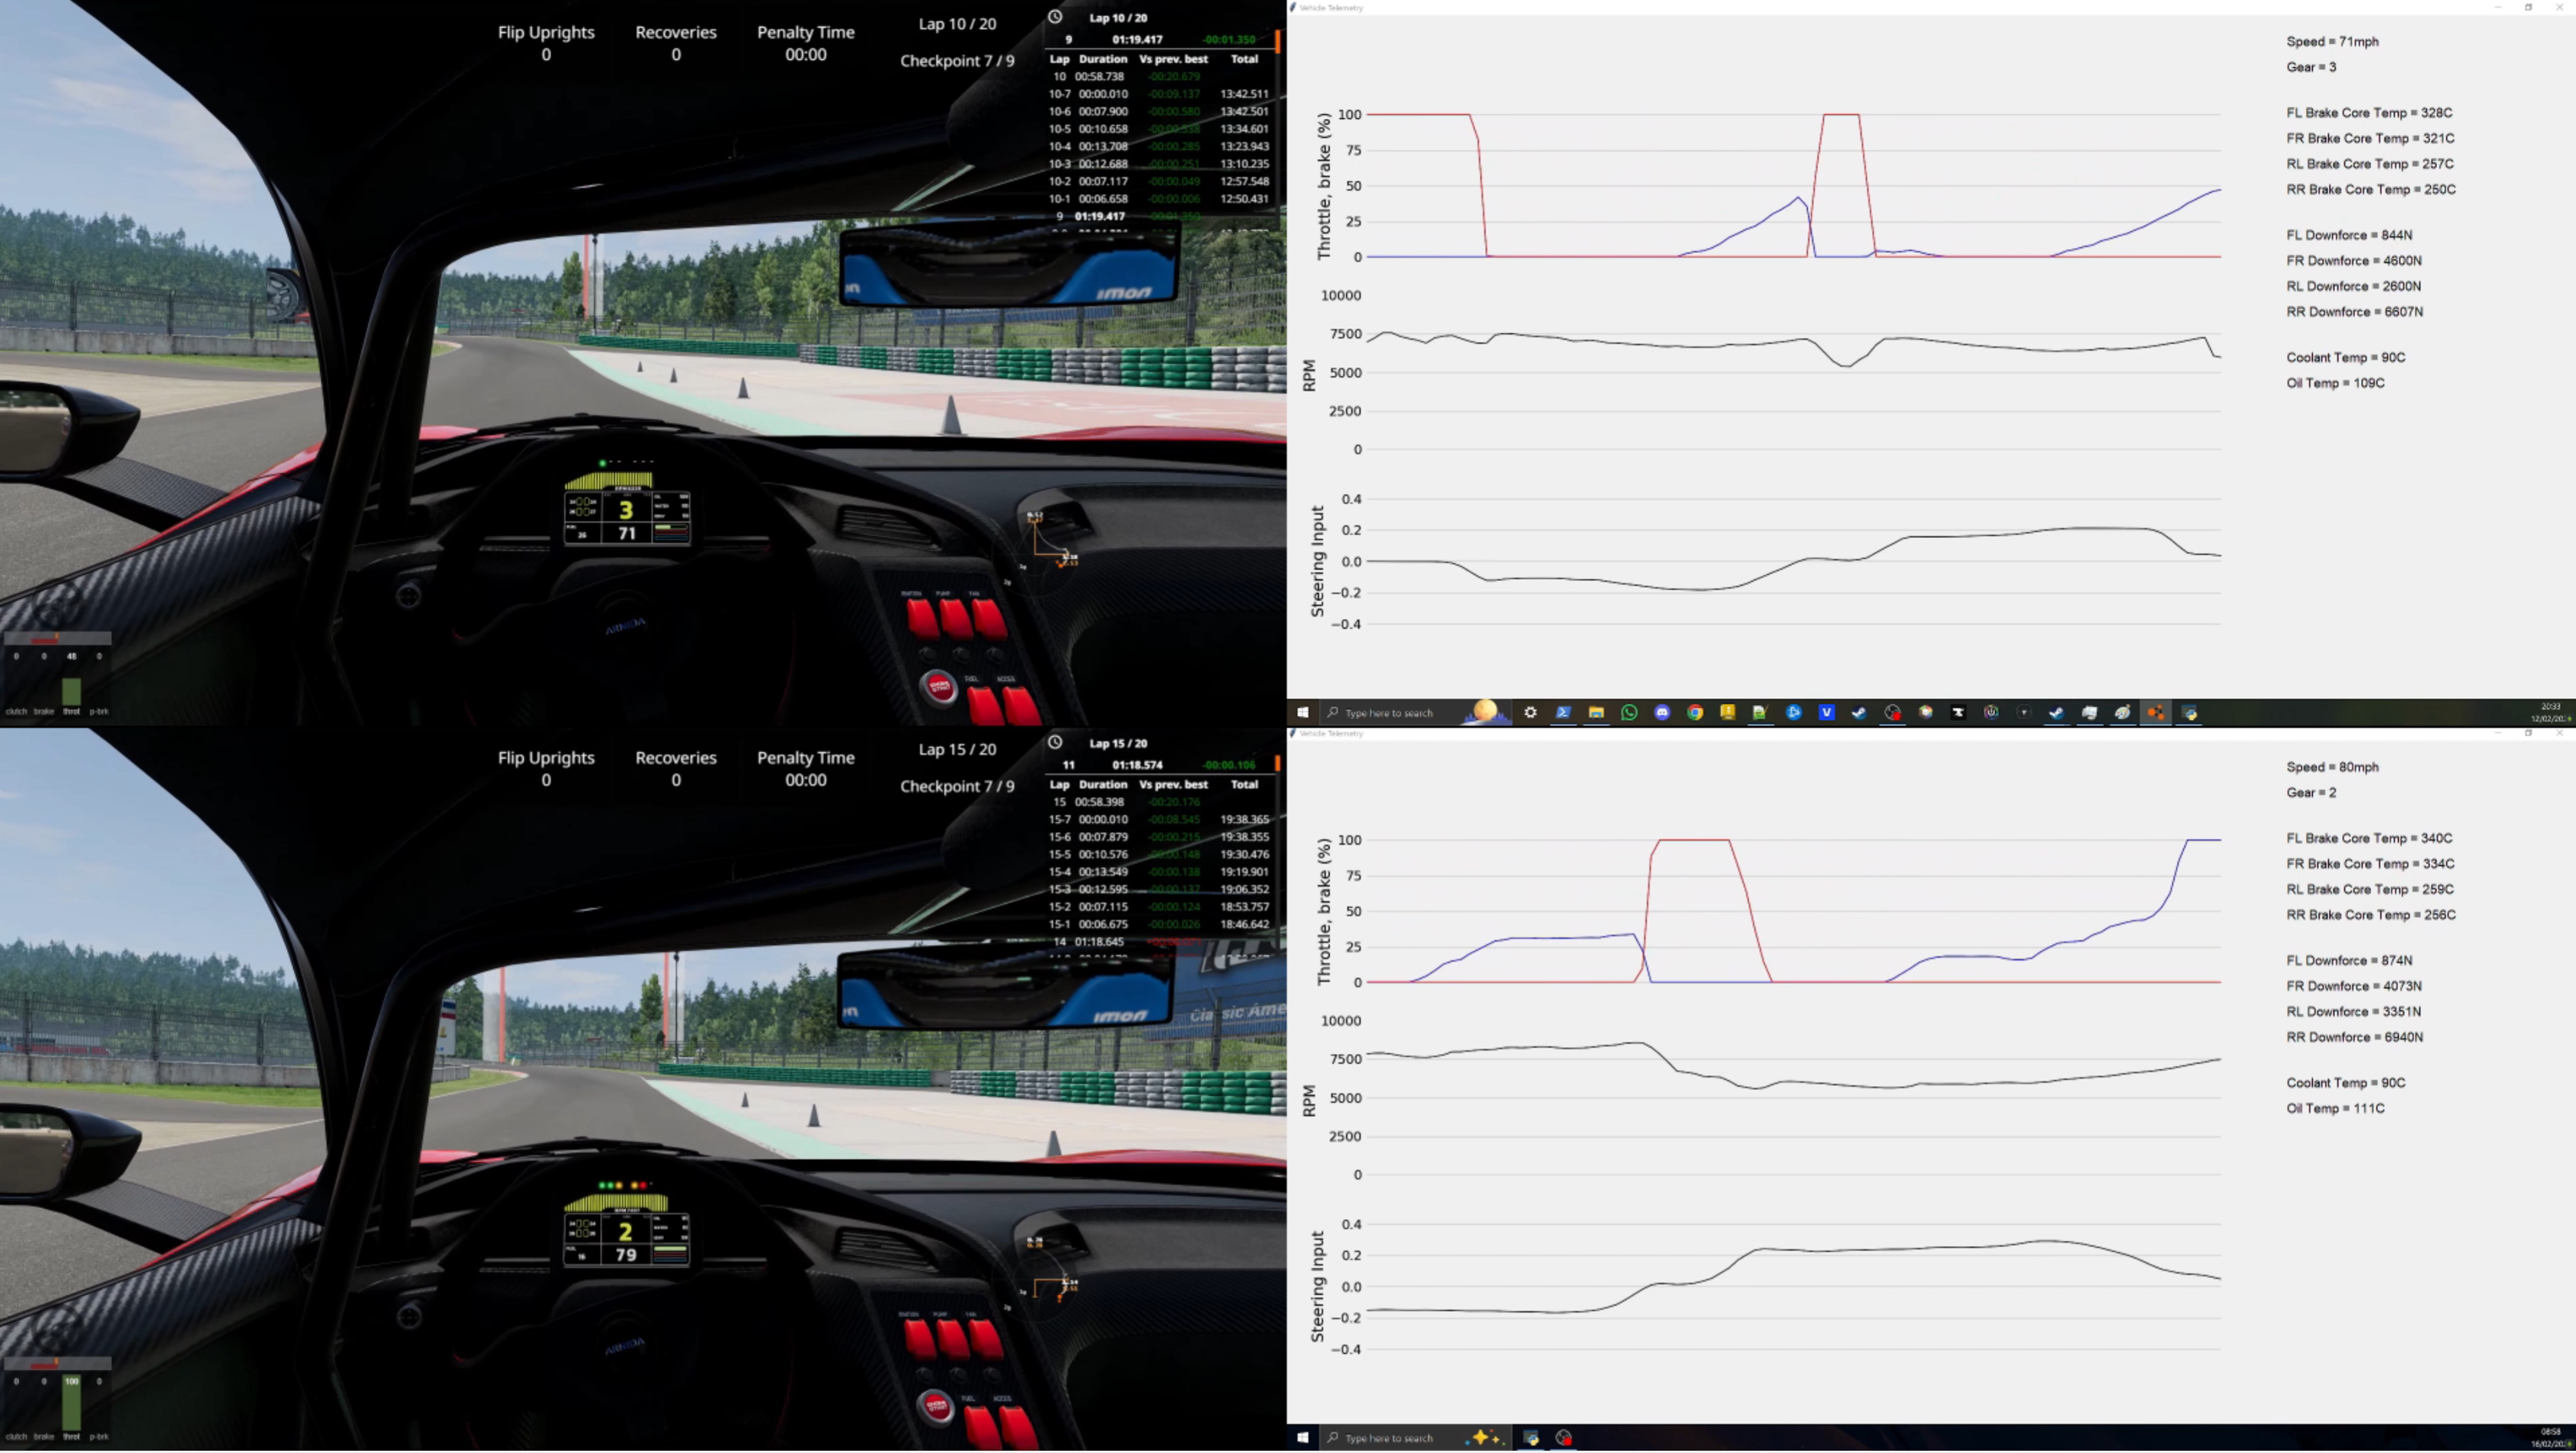
Just after Turn 13
Turns 14-17
This series of chicanes required precise positioning. Taking too much kerb was risky — inside of the kerbs had sand with zero grip, and going too fast would sink the car into the sand, causing damage if the kerb hit something other than the tyre.
The best approach was to brake into Turn 14, rotate into Turn 15, and then straightline the remaining chicanes as much as possible. By the time I exited Turn 15 with setup 2, I was only just entering it with setup 1. I was able to carry more speed through Turns 16 and 17 with setup 2.
This section of the track showed the most significant difference between the setups, with setup 2 carrying much more speed.
Turn 18 (Final Turn)
The last turn was a long hairpin leading onto the start/finish straight. My goal was to get on the power as early as possible to maximize speed across the line. I tested different lines to achieve this.
With setup 2, I could rotate the car much more effectively, allowing me to apply full throttle while still turning slightly. If I attempted this with setup 1, I would have spun out. The exit speed difference between the setups was around 10-15 mph, and by the time I crossed the line, setup 2 had a ~7 mph advantage.
Exiting Turn 18
Speed difference after exiting Turn 18
Final Times
Best time with:
Pre-tuning: 1:18:916
Post-tuning: 1:18:103
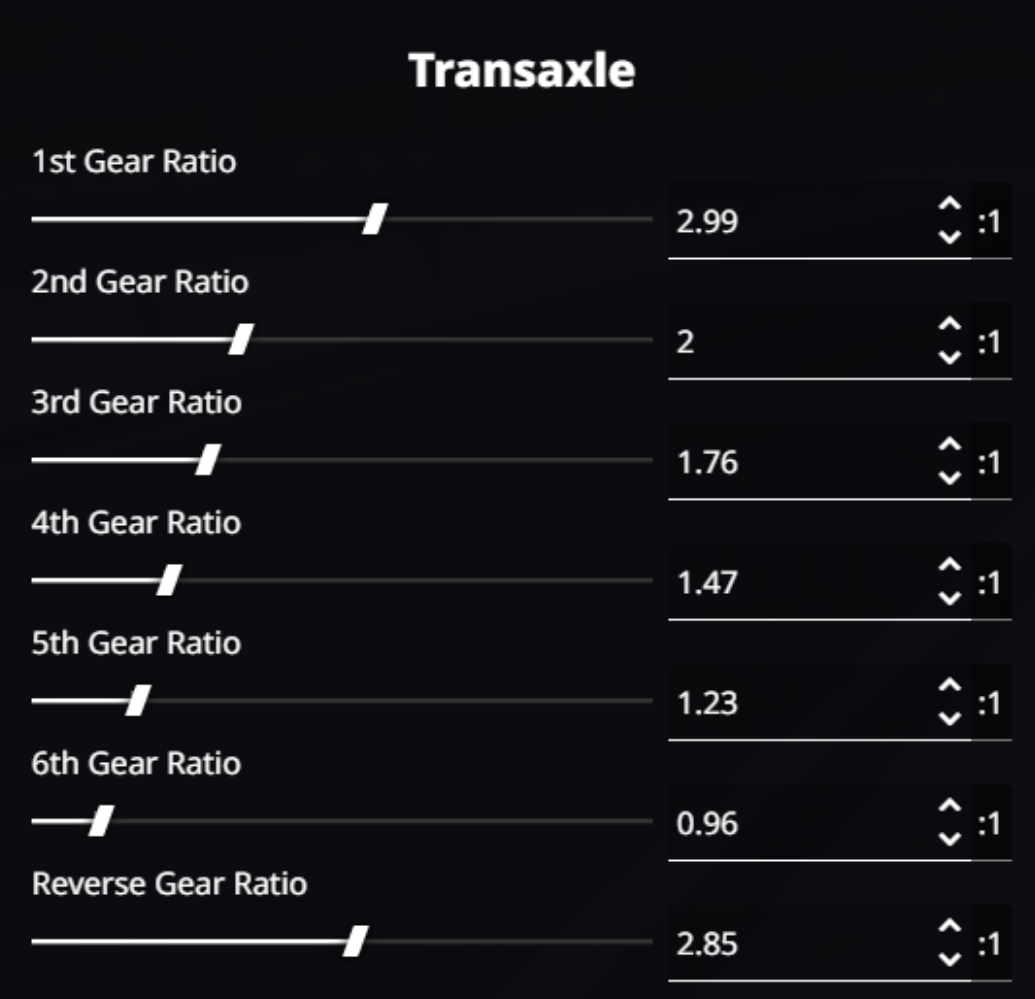
I feel that a sub 1:18 is possible, but this would require more precise tuning and a lot more laps. The gear ratios could also be properly adjusted.
Future work
A main area I’d like to work on in the future is to improve the live graph plotting capability to achieve smooth graphing with multiple graphs. This would require in-depth research of using a Python program on multiple threads, or using a different programming language that may be better suited to such a program.
Furthermore, I found it difficult/limiting trying to place the graphs/labels exactly where I wanted with Tkinter. There may be better GUI packages that allow for more customisability and ease of use.
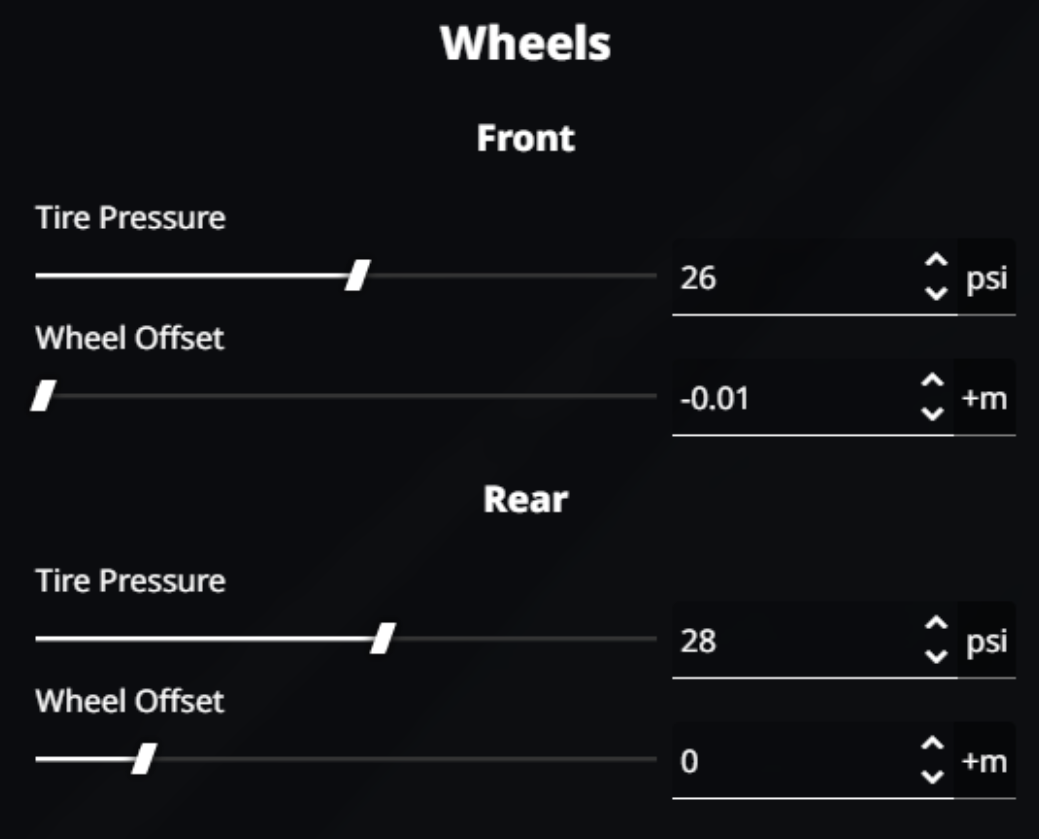
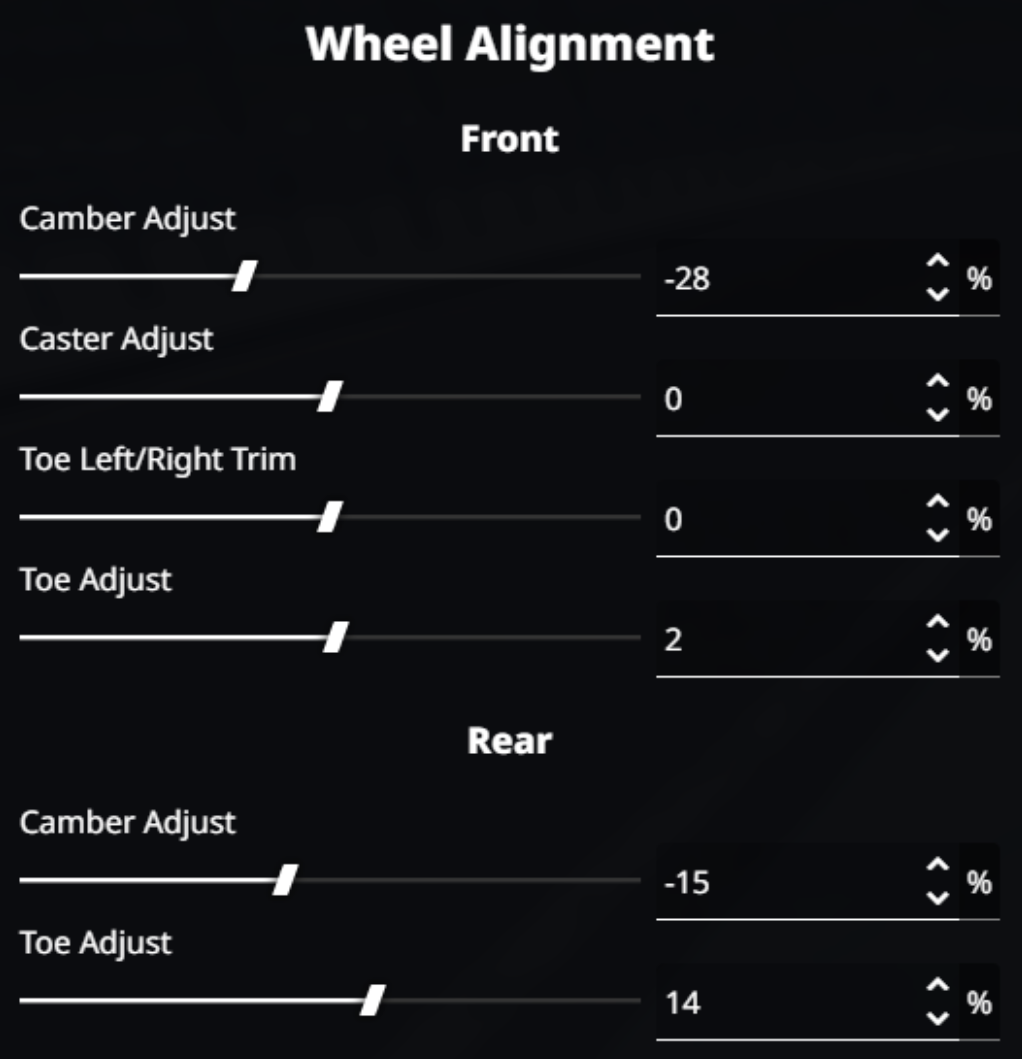
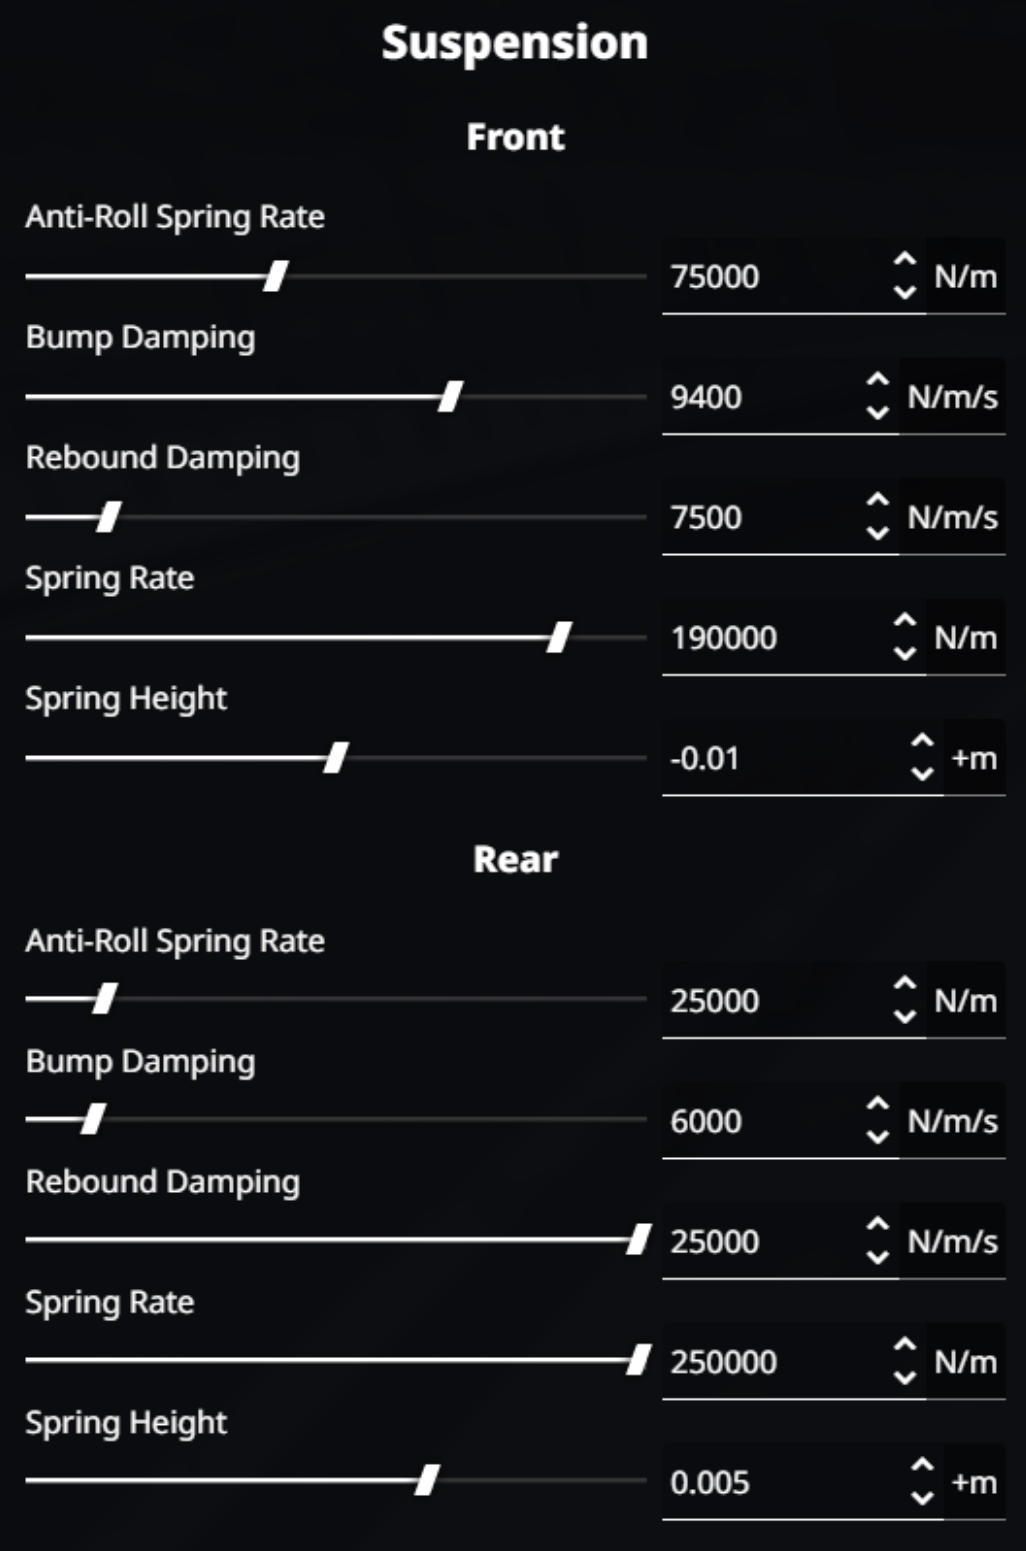
Appendix
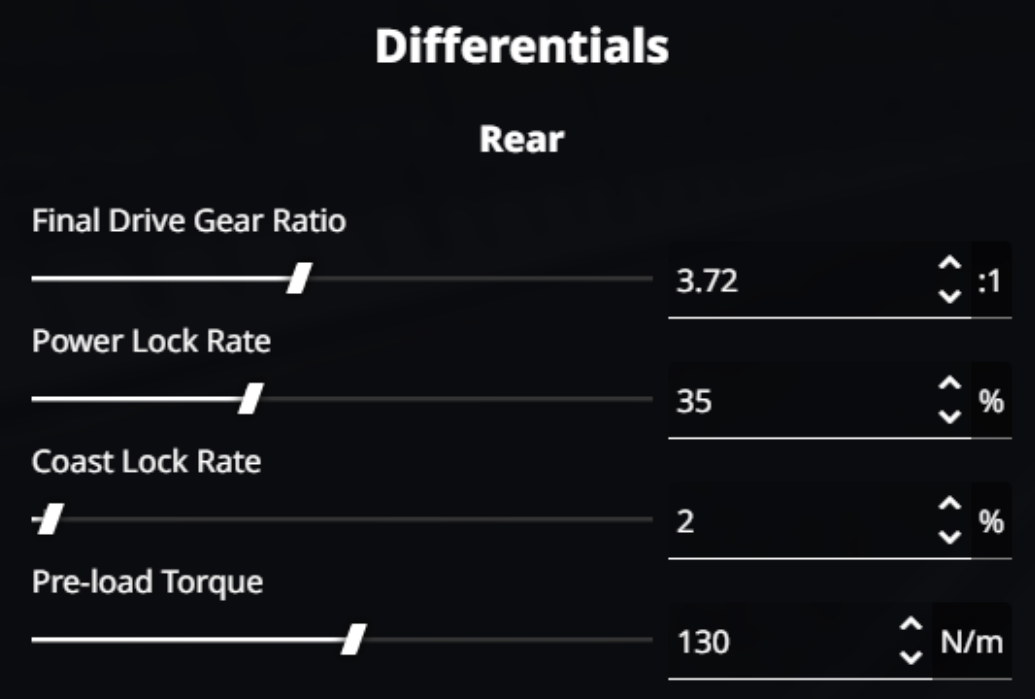
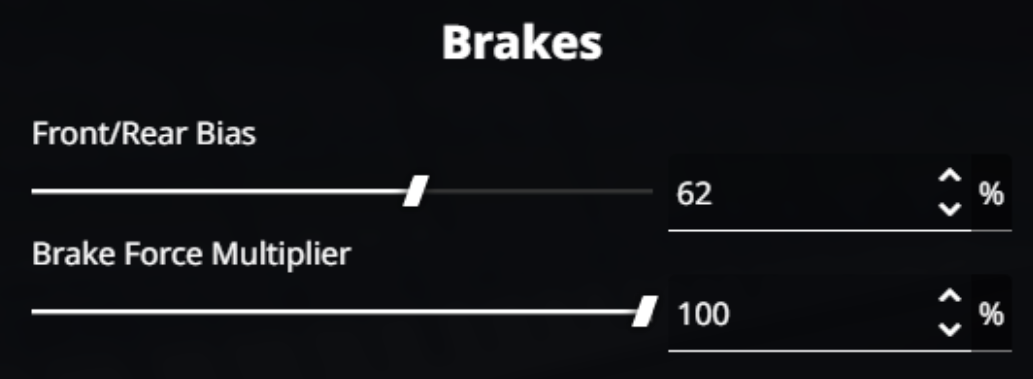
Pre-tuning details
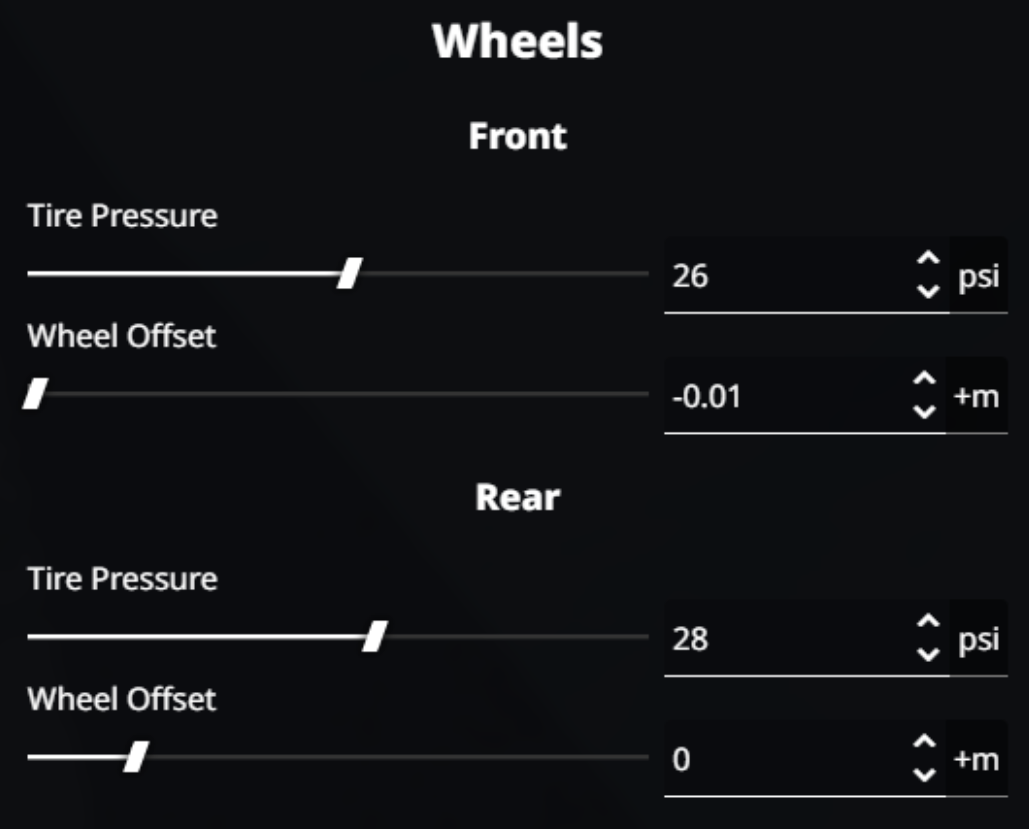
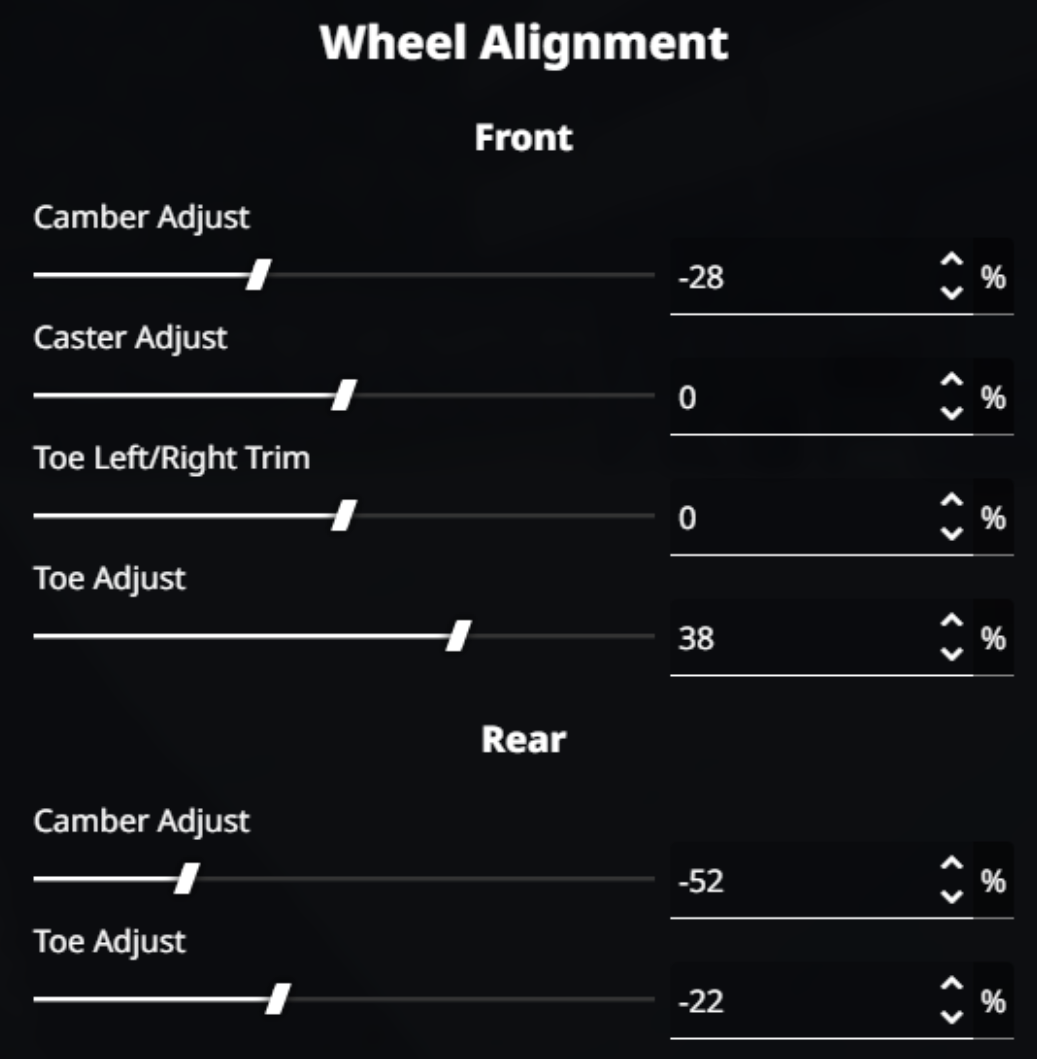
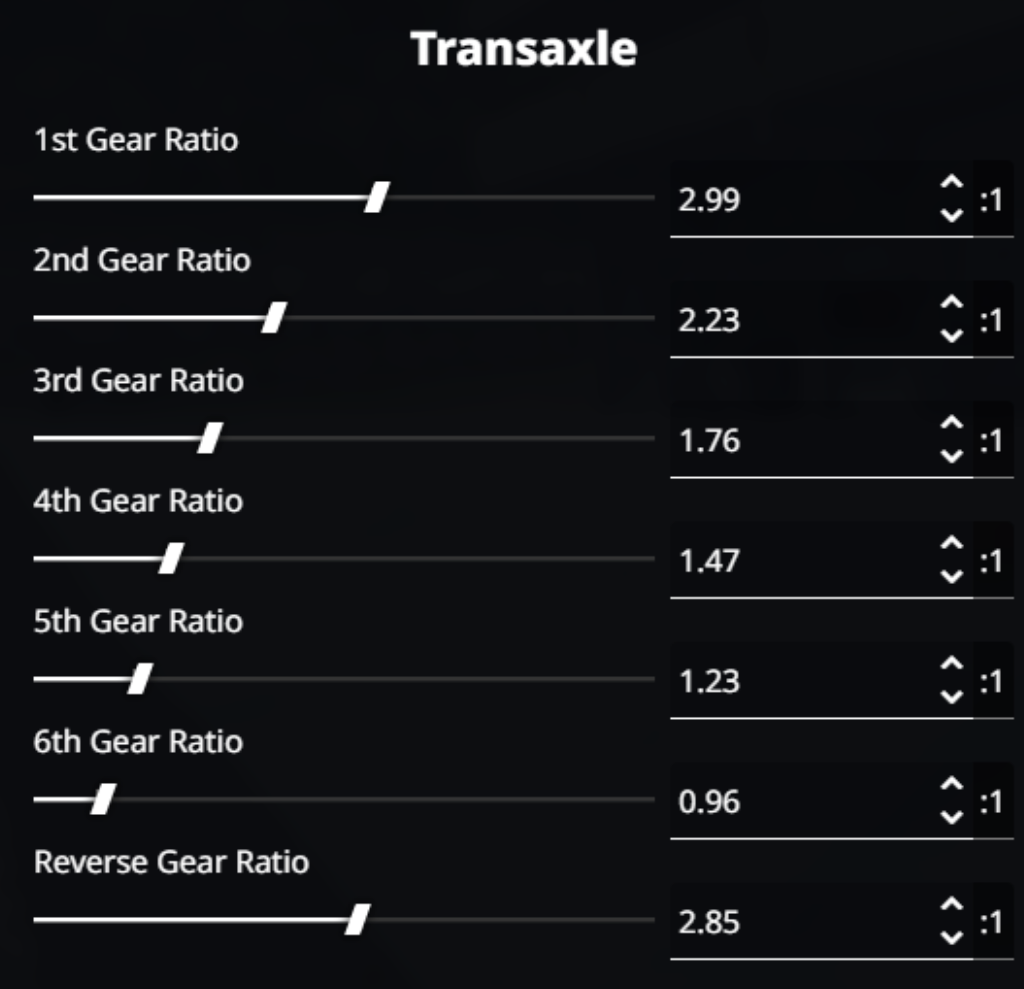
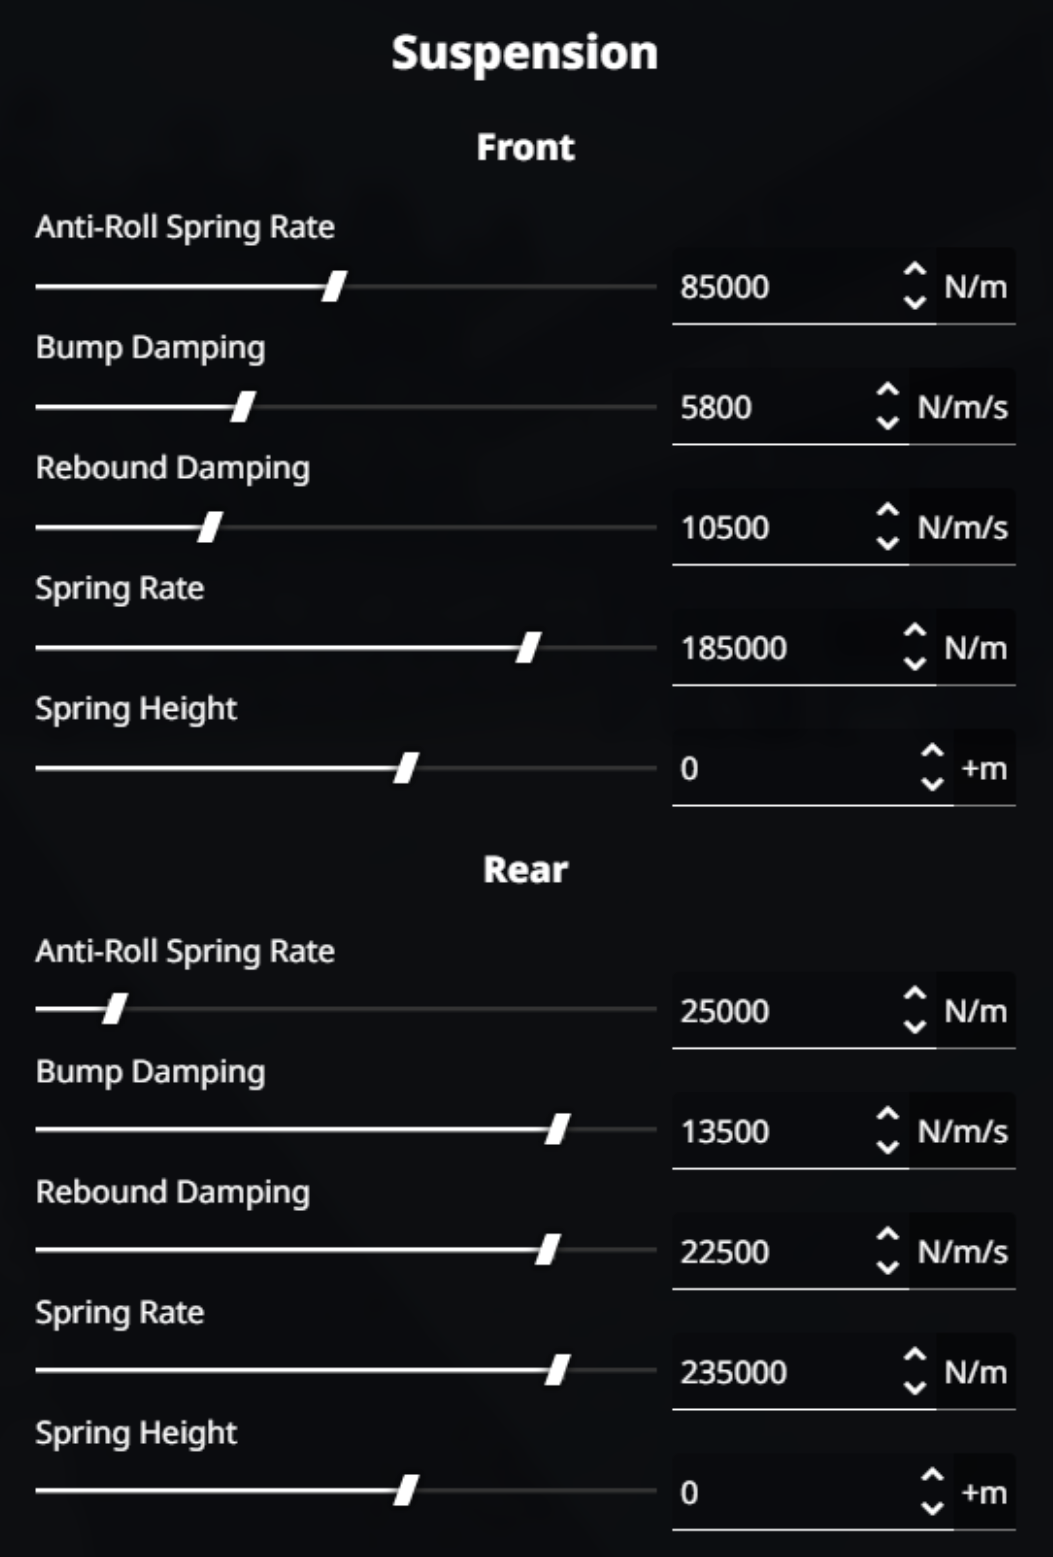
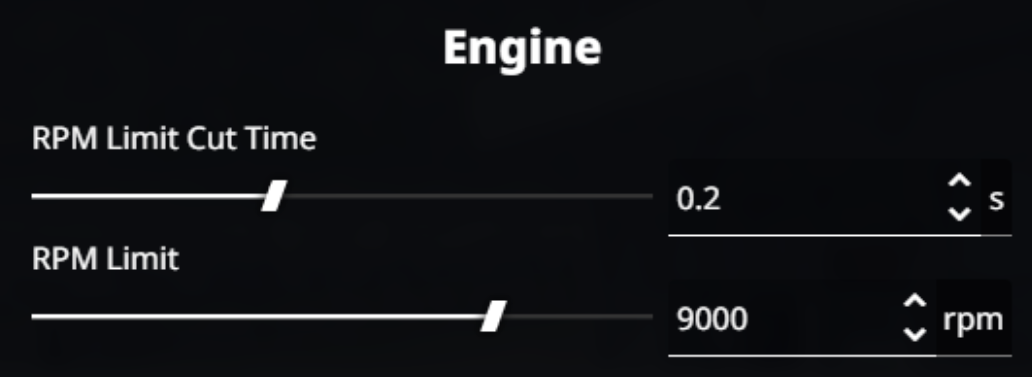
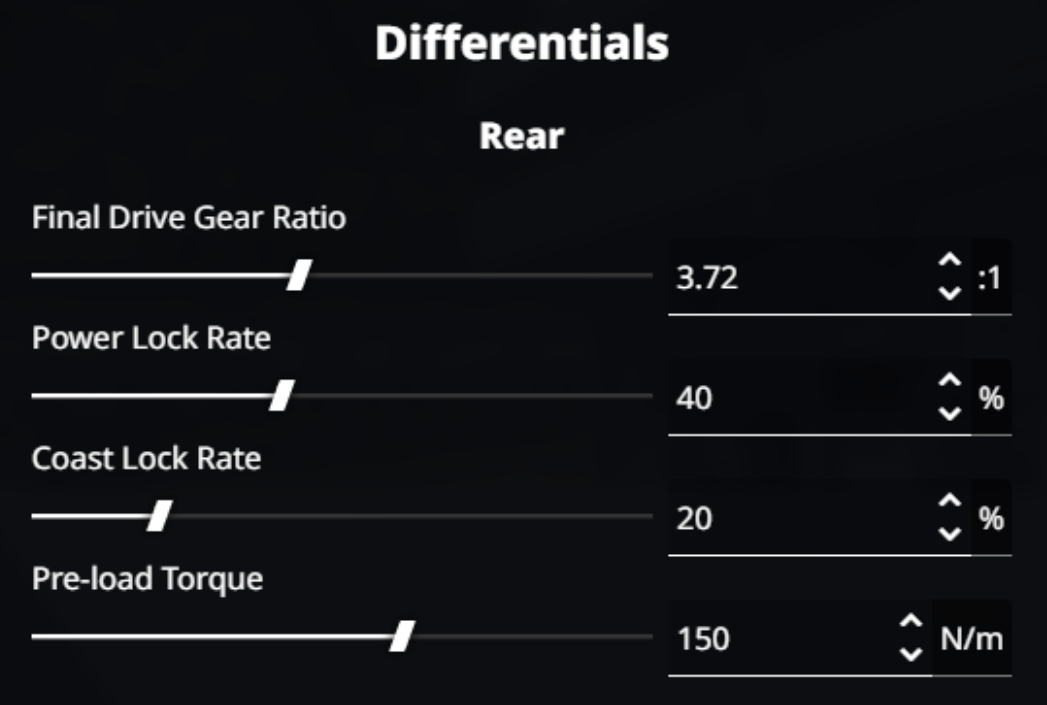
Post-tuning details